Carbon dioxide’s fingerprint

In the year 2000, Harro Meijer, Professor of Isotope Physics at the University of Groningen, set up the Lutjewad Measurement Station near Hornhuizen. That is where he and his team have been measuring the composition of the atmosphere, including carbon dioxide (CO2) concentrations in the air, for over 25 years. By looking at the various forms of carbon in the measurements, researchers from Groningen are mapping where the CO2 originates and where it ends up.
FSE Science Newsroom | Text Charlotte Vlek | Image Leoni von Ristok
This is the first part in a series about research on the carbon cycle: the cycle in which carbon is exchanged between atmosphere and oceans, plants, and rocks. This cycle becomes unbalanced if we humans release too much CO2 into the atmosphere. This article is about carbon measurements in the atmosphere.
‘Did you know that plants grow better these days due to higher concentrations of carbon dioxide (CO2) in the atmosphere?’ says Meijer. ‘We also notice that atmospheric CO2 concentrations currently fluctuate with greater highs and lows: plants absorb slightly more carbon during the growing season; however, this all returns to the atmosphere at the end of the season.’
Groningen pioneered isotope measurements
‘In the 70s, 80s, and 90s of the previous century, we (here in Groningen) pioneered in the field of isotope measurements of atmospheric CO2,’ says Meijer. ‘From the start, our research revolved around good calibration of the measurements. By calibrating carefully, you ensure continual valuable measurements with high accuracy.’
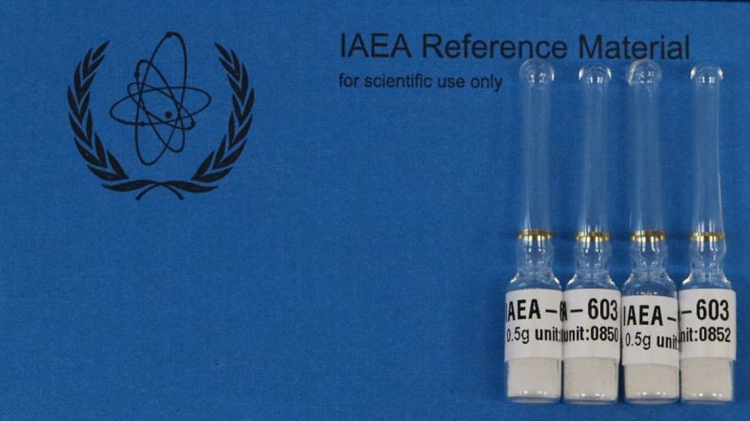
Because when looking at ratios of atmospheric carbon-12 and carbon-13, we are looking at deviations in fractions of a per mille, Meijer explains. And these deviations must be related to the standard ratio in your reference material, a piece of calcite to be precise, that is stored at the International Atomic Energy Agency (IAEA) in Austria.
‘Every time you want to compare your measurements with the reference material, you use a small fragment of it. That would have to be sent from Austria each time. Instead, we have (here in Groningen) our own reference material that is exactly attuned to that of the IAEA. And then it still requires skill to dissolve that carefully into a gas mixture with which you can compare your atmospheric measurements.’
Meijer’s measurements reflect how the atmospheric CO2 concentrations ‘breathe’ along with the seasons. However, the total concentration also increases over the course of several years and that is due to the CO2 emissions caused by humans. Meijer: ‘The annual human contribution is relatively small compared to the larger total. But since it is not a cycle, it accumulates.’ That is because the carbon that we, people, introduce into the atmosphere through the use of fossil fuels originates from the deep layers of the Earth where it would have been stored for many thousands to millions of years.
Not all carbon is the same
With his research, Meijer intends to map how carbon circulates between atmosphere, plants, oceans, and rocks. He does this by studying the three forms of the carbon atom that occur in nature: carbon-12, carbon 13, and carbon-14. These are the different isotopes of carbon; they differ in the number of particles in the atomic nucleus. Having one neutron more or one less means it is still carbon, only a little heavier or lighter than the other relatives.
No carbon-14 in fossil fuels
Meijer studies mainly the stable isotopes carbon-12 and carbon-13. These are the carbon variants that always remain as they are. But carbon-14, the unstable little sister, decays over time. That is why carbon-14 is so useful for carbon-14 dating: by looking at how much carbon-14 is present in organic matter, researchers are able to determine how old it is.
‘Fossil fuels are, essentially, very old plant material,’ describes Meijer, ‘so they have no carbon-14 left. This is not the case for biofuels that are made from new plant material and, consequently, the atmosphere shows from which fuels the CO2 emissions originate. Moreover, measuring carbon-14 is the only way to test whether biofuels and biomaterials are truly ‘bio.’

The carbon variants that Meijer is measuring in the atmosphere are like a fingerprint that shows the material’s source. For example, it can be clearly deduced that the increase in atmospheric CO2 is due to the use of fossil fuels. However, Meijer is also interested in the continuation of the cycle, such as how much of the atmospheric carbon ends up in plants and oceans. This is something he can also infer from his measurements.
It is all about ratios: carbon-12 and carbon-13 occur, in principle, in a set ratio and when this ratio deviates from the standard, it means that plants have absorbed some of it. ‘That is because plants prefer carbon-12, whereas oceans have no preference,’ explains Meijer. ‘That is why we look at how much more carbon-13 is proportionally present in the atmosphere and then you know that its counterpart carbon-12 must have been absorbed by plants.’
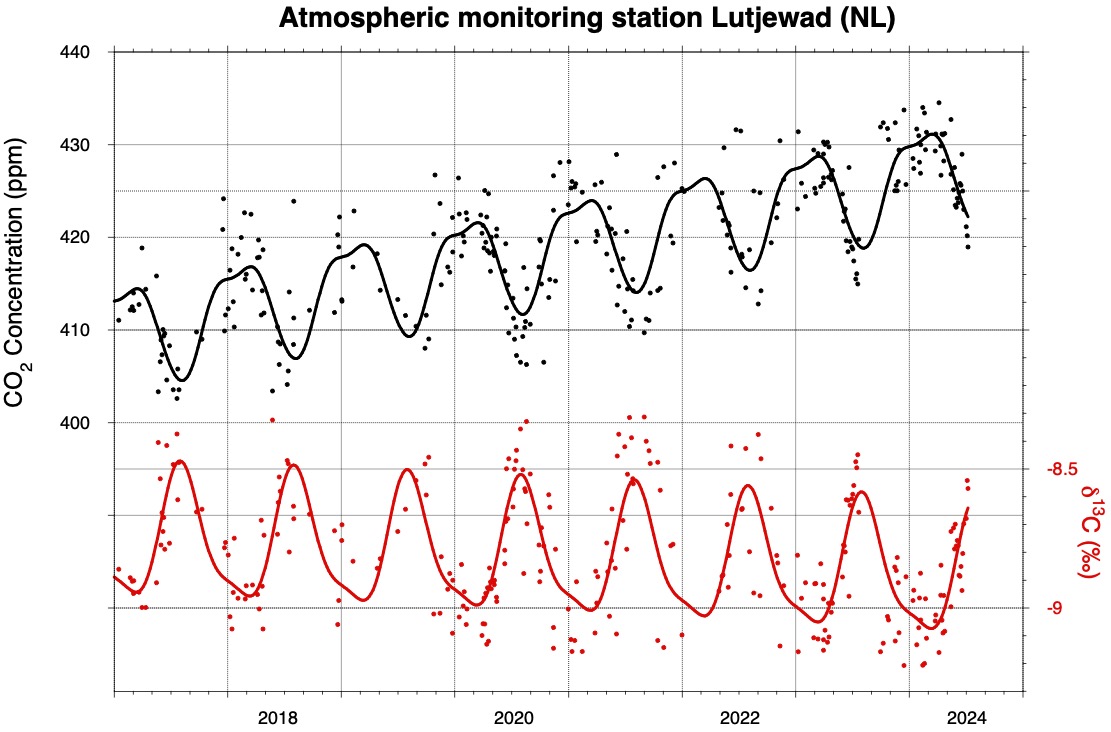
What the red curve shows about the source and uptake of carbon dioxide
This graph shows the CO2 concentration (in black) and the proportion of carbon-13 in it (in red). Over the years, the black curve increases: more CO2 ends up in the atmosphere. The red curve increases as plants take up CO2: because they prefer carbon-12, a relatively large proportion of carbon-13 remains. This way, the red line indirectly shows the uptake of CO2 by plants.
The red curve also reveals the source of the CO2 that is added to the atmosphere. 'CO2 that comes from fossil fuels is in fact from ancient plant materials,' Meijer explains, 'and therefore it contains less carbon-13.' As a result, burning fossil fuels leads to an increase for the black curve (the total amount of CO2) but not for the red curve (the proportion of carbon-13)
Measuring human effects
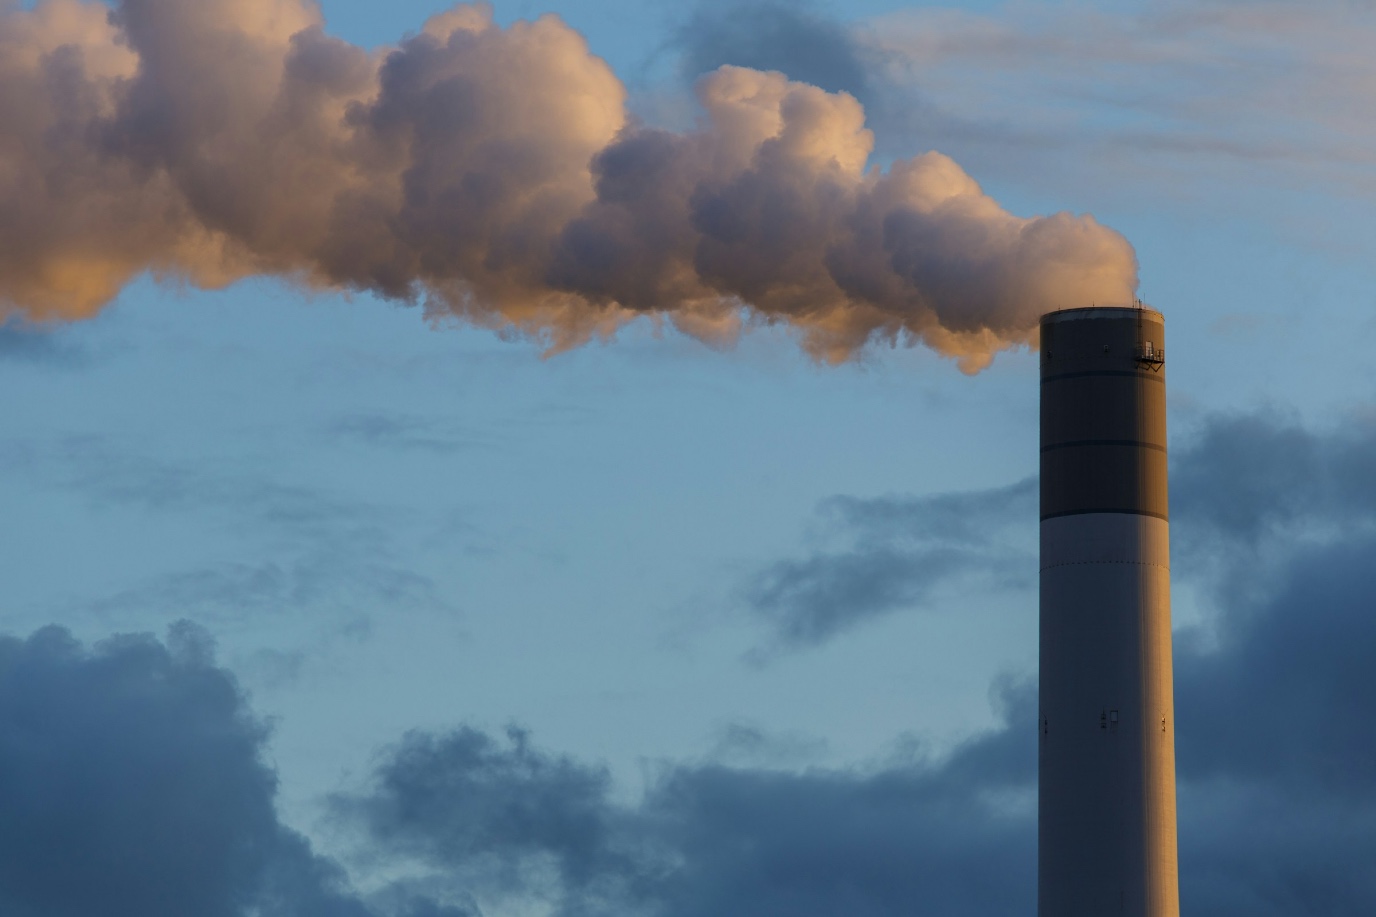
When there is a northerly wind, we can see exactly how much the emissions from the industry in Rotterdam add
Of course, Meijer also measures 'ordinary' CO2 concentrations in the atmosphere, for example to check if the actual emissions around an industrial area align with what is recorded on paper. ‘In such a case, we measure to the south of Rotterdam, for example. We measure the baseline concentration of atmospheric CO2 and when there is a northerly wind, we can see exactly how much the emissions from the industry in Rotterdam have added to this.’
And has Meijer also observed any positive human effects over the years? ‘Certainly, you see, for example, that reforestation reduces the atmospheric CO2 concentration. However, then there will be forest fires, that are sometimes again the consequence of human activities, and these, conversely, increase the concentration.'
Read more:
Klaus Hubacek analyses the effects of various green solutions to reduce CO2 emissions — such as planting more trees, sharing cars, or working less — to find out whether they realize their intended outcome. Spoiler: almost everything has a downside, yes, even planting trees in some cases.
‘Fortunately, seawater absorbs carbon dioxide (CO₂). If it didn’t, things would have been over and done with already,’ according to climate and ocean researchers Richard Bintanja and Rob Middag. But what actually happens to the ocean's carbon absorption as the climate changes?
Earth's natural carbon cycle becomes unbalanced if we, humans, continue to release extra carbon dioxide (CO2) into the atmosphere. In this overview article about the carbon cycle, you can find out how Earth generally keeps itself in balance and how we, humans, have upset this balance over the past two hundred years.
More news
-
16 July 2026
Veni-grants for 21 UG researchers
-
-
09 July 2026
How do we keep medicines out of the environment?