Observations
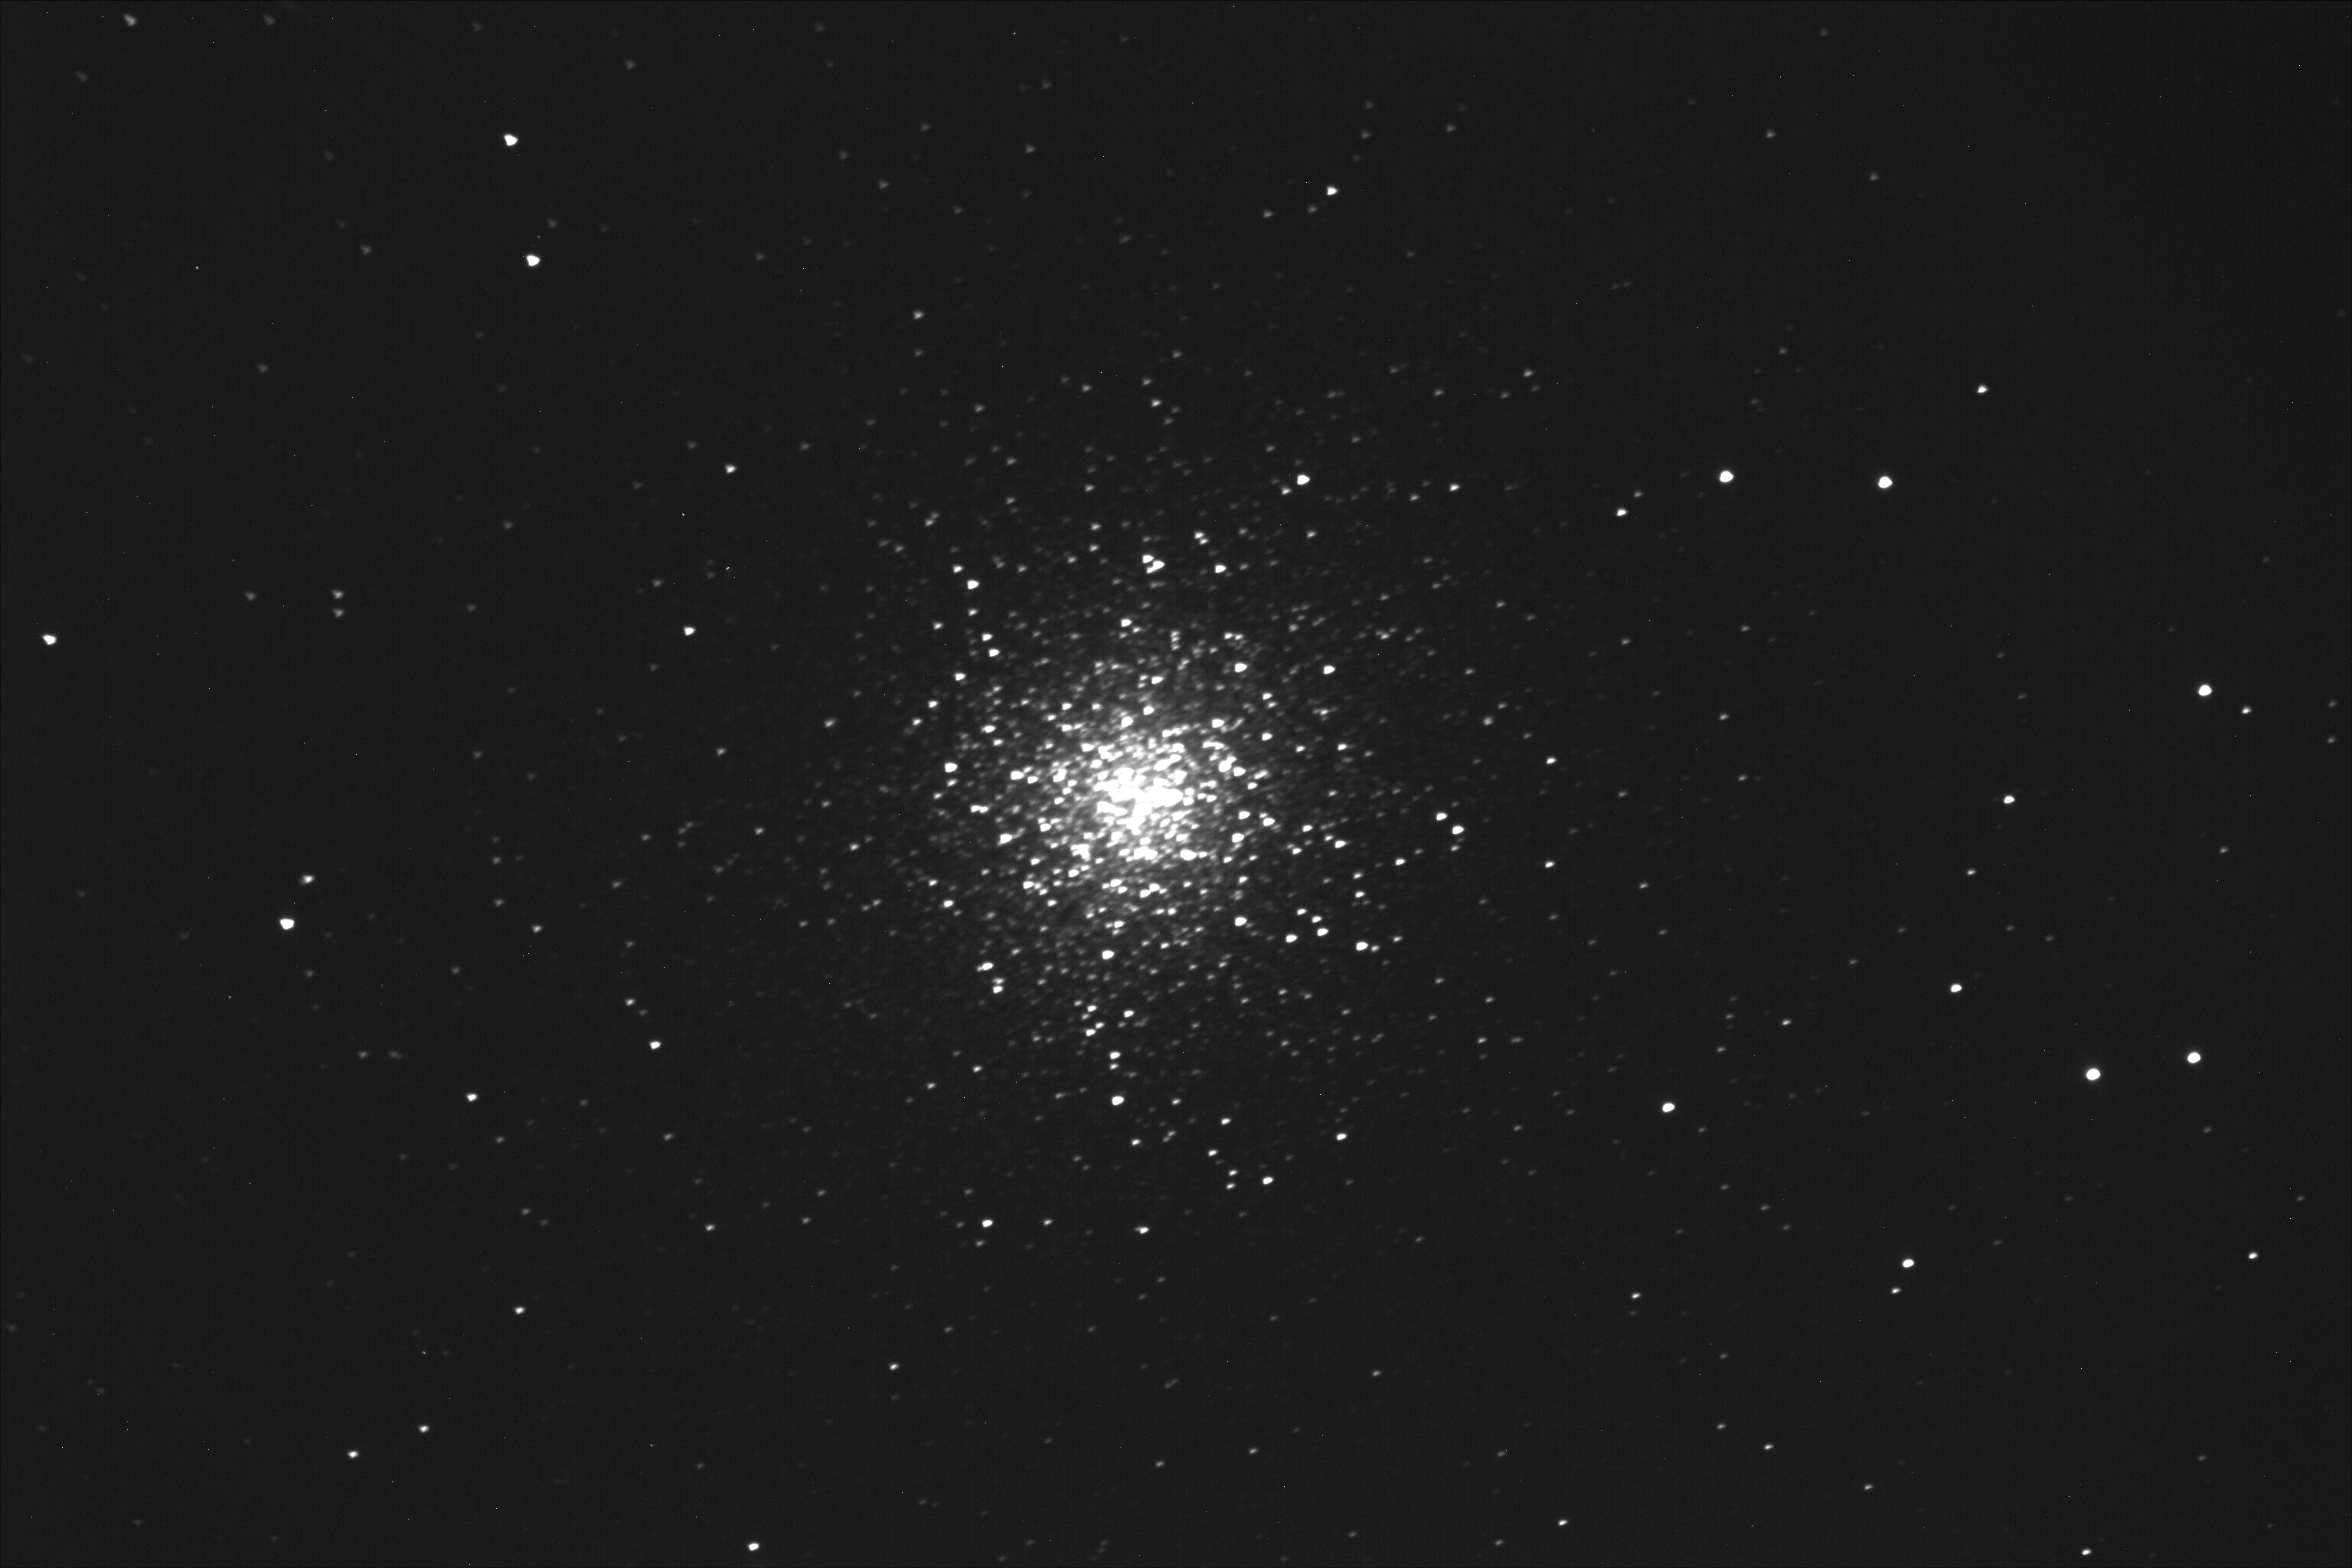
Some great shots have already been made with the Gratama Telescope. The examples below give an impression of the possibilities.
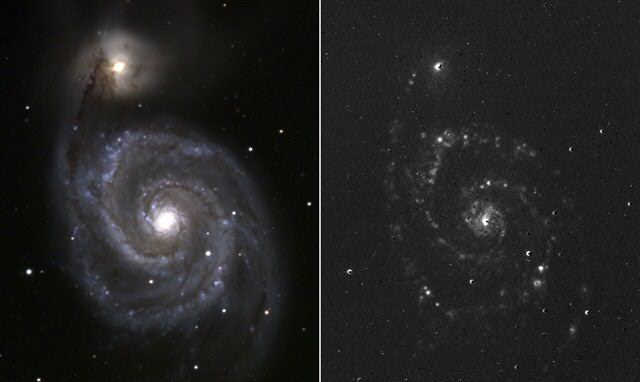
![The left image shows the relationship between the brightness of the H-alpha and the H-beta emission lines; light yellow indicates a high intensity and dark blue a low intensity. This ratio is a measure of the amount of dust present between the observer and the glowing hydrogen gas in the mist. The right picture shows the ratio between the brightness of the [OIII] and the H-beta emission lines and is a measure of the ionization degree of the gas.](/research/kapteyn/sterrenwacht/resultaten-items/m42_2ratios.jpg)
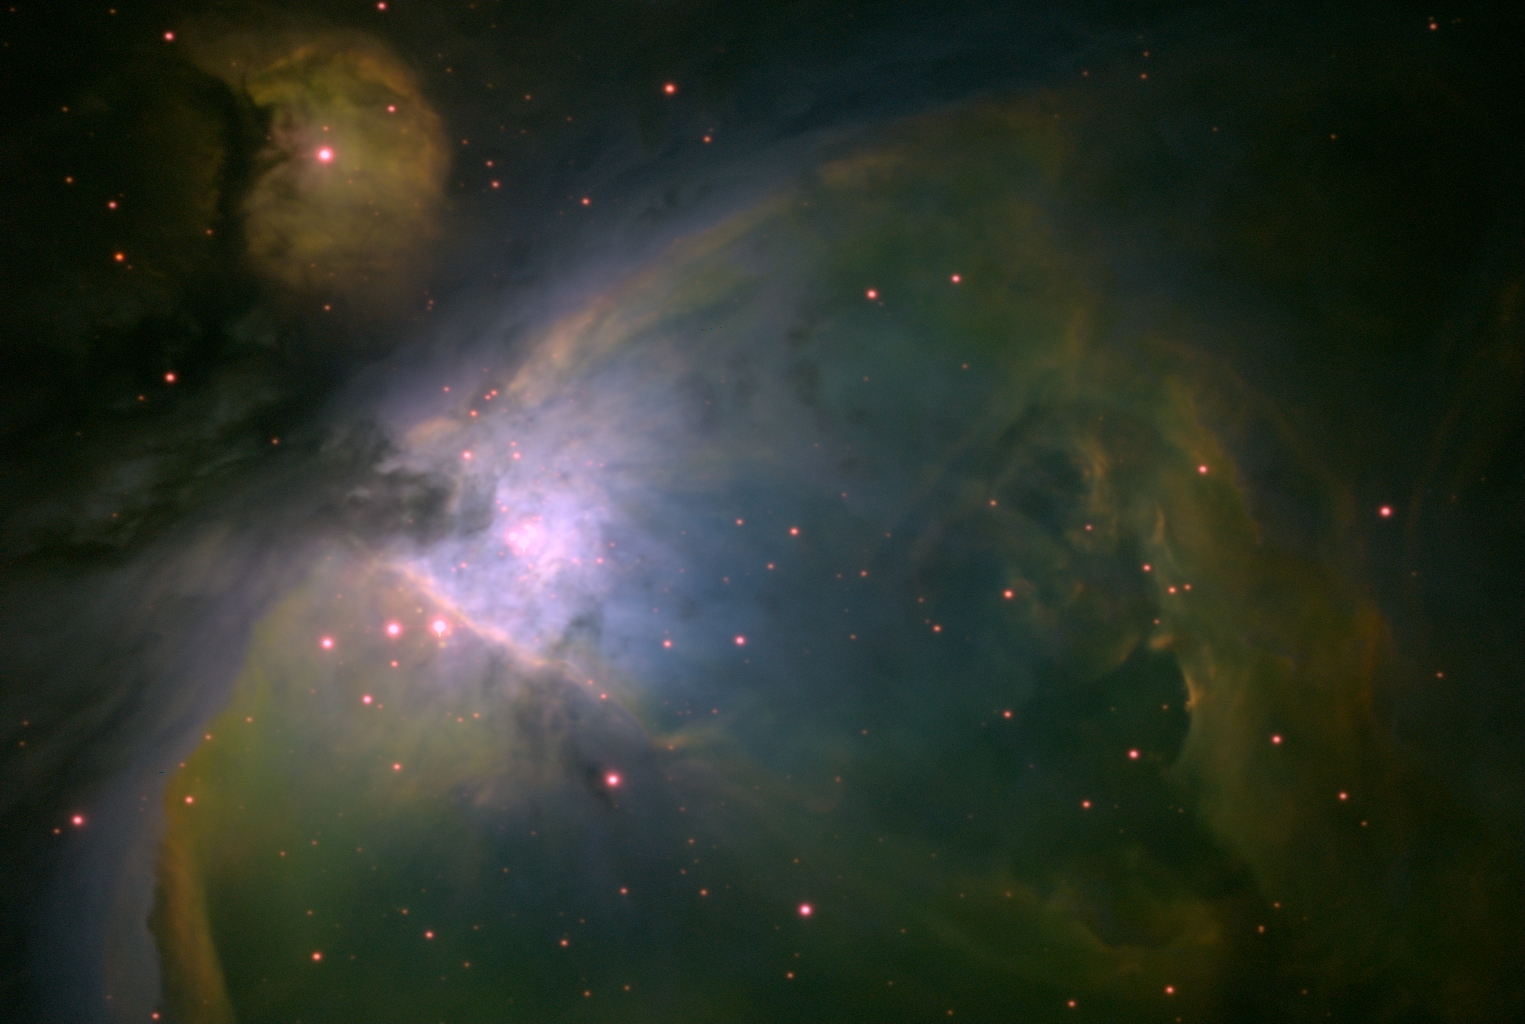
![A recording of the Orion Nebula through 3 'narrowband' filters: 5x8 minutes though the [SII] filter (red), 7x8 minutes though the H-beta filter (green), and 5x8 minutes through the [OIII] filter (blue).](/research/kapteyn/sterrenwacht/resultaten-items/m42.jpg)
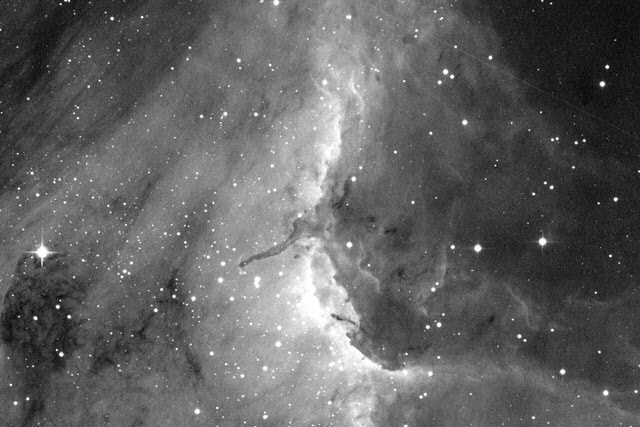
![Here we have a recording of the Eagle Nebula, a star formation area in the Milky Way. The 'false colours' show how the hydrogen gas, oxygen gas, sulphur gas and dust are distributed. A group of newly formed bright stars is located right above the centre. These stars are lighting up the gas clouds in the nebula. In order to create this image, the CCD was illuminated 2x30 minutes through the [OIII] filter (blue), 1x30 minutes through the H-alpha filter (green) ans 2x30 minutes through the [SII] filter (red).](/research/kapteyn/sterrenwacht/resultaten-items/messier16_rgb.jpg)
Last modified:09 April 2026 09.46 a.m.
View this page in: Nederlands
Some great shots have already been made with the Gratama Telescope. The examples below give an impression of the possibilities.