Skip to ContentSkip to Navigation
Research Kapteyn Institute The Blaauw Observatory

Observations

Using the Gratama Telescope a number of beautiful shots have been made already. The examples showed below will give an impression of all the different possibilities using this telescope.

A recording of the Orion Nebula, a star formation area in the Milky Way. The recording was made by Nynke Oosterhof (Biology) and Mike Chesnaye (Artificial Intelligence) for their minor in Astronomy.
A recording of the supernova in the night of January 28-29 in the year 2011. The galaxy NGC 2655 is located in the middel of the image. The supernova is the bright bue-and-white star at the bottom left of the galaxy system.
An image of the moon. Using a telescope or binoculars, structures sush as craters on the moon that cannot be seen with the naked eye become visible.
An image of the globular cluster M53 (Messier 53), taken with the 'broadband' B- (blue), V- (green) and R- (red) band filters.
The left image shows the relationship between the brightness of the H-alpha and the H-beta emission lines; light yellow indicates a high intensity and dark blue a low intensity. This ratio is a measure of the amount of dust present between the observer and the glowing hydrogen gas in the mist. The right picture shows the ratio between the brightness of the [OIII] and the H-beta emission lines and is a measure of the ionization degree of the gas.
A recording of the Orion Nebula through 3 'narrowband' filters: 5x8 minutes though the [SII] filter (red), 7x8 minutes though the H-beta filter (green), and 5x8 minutes through the [OIII] filter (blue).
Here we have a recording of the Eagle Nebula, a star formation area in the Milky Way. The 'false colours' show how the hydrogen gas, oxygen gas, sulphur gas and dust are distributed. A group of newly formed bright stars is located right above the centre. These stars are lighting up the gas clouds in the nebula. In order to create this image, the CCD was illuminated 2x30 minutes through the [OIII] filter (blue), 1x30 minutes through the H-alpha filter (green) ans 2x30 minutes through the [SII] filter (red).
This is an H-alpha image of the Pelican Nebula in the Swan constellation. The CCD is illuminated 2x30 minutes through the H-alpha filter. The shot reveals structures of swirling gas and dust. In the top right corner you can find a track of a satellite that traversed the image field during recording.
Zoomed version of system NGC 4088 of the image below (right), compared with a previous image of the same system (left) when the supernova was not yet at the same spot as shown in the right image.
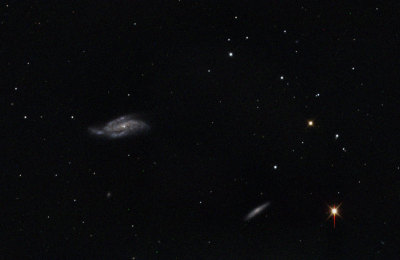
A redording of the supernova SN2009dd in NGC 4088, on the night of April 15-16. The smaller system at the bottom right is the system called NGC 4085. The total exposure time was 10x10 minutes through the B-band, 7x10 minutes through the V-band, and 4x10 minutes through the R-band. The blue supernova is right next to the orange core of NGC 4088 (see image shown above).
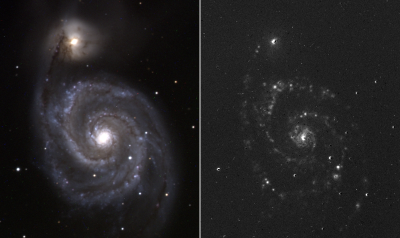
The night of April 18-19 was of such an irresistible observing quality, that Marc Verheijen went to the Gratama telescope to see whether is was possible to do an H-alpha observation of a nearby galaxy. The M51 system became the target. The observation lasted 4x30 minutes in the B-band, 3x30 minutes in the V-band, 2x30 minutes in the R-band and 4x30 minutes in the H-alpba band. On the left you can see the produced colour image and on the right the system in H-alpha radiation. Numerous H-alpha areas can be made visible with the Gratama telescope. In these areas there is ionized hydrogen gas.
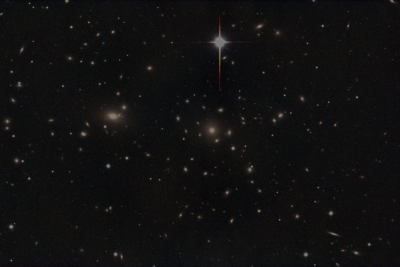
On another beautiful night, the night of April 17-18 in the year 2009, Marc Verheijen made an observation an created an image of the Coma cluster to see what the telescope was capable off. The observation lasted 5x30 minutes in the B-band, 4x30 minutes in the V-band and 3x30 minutes in the R-band. The Coma cluster is one of the largest accumulations of galaxies in the nearby universe. These galaxies move away from us at 7200 kilometres per second. Furthermore, its light has travelled 330 million years to finally be captured by our telescope.
Colour plate of Messier 101 (M101). The observation lasted 10x10 minutes in the B-band, 7x10 minutes in the V-band and 5x10 minutes in the R-band with the crescent Moon above the horizon.
The Messier 81 (M81) spiral galaxy. Multiple shots through different colour filters are combined to make this colour image. The total exposure time was 3 hours and 10 minutes.
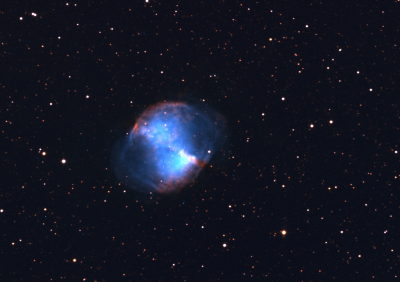
Shot of the planetary nebulea, Messier 27 (M27) also known as the Dumbbell nebula. This colour image was made by combining the light of oxygen (blue-green) and hydrogen (red). A planetary nebula arises when a bright star (like the Sun) emits its outer layers at the end of its lifetime.
The first shot made with the new telescope. This image is from the beautiful globular cluster Messier (M13). There is no focus, no tracking and the 60-second-observation has not been edited.
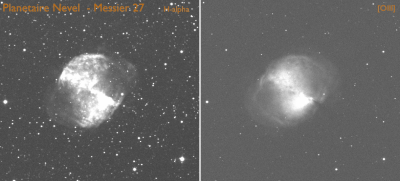
Shooting in the Dumbbell Nebula (M27) in two colours: H-alpha (deep red) and OIII (blue-green). THe H-alpha recording reveals the presence of hydrogen and the oxygen recording reveals the presence of oxygen.
A shot of the Whirlpool Galaxy (M51). This is a galaxy like our own galaxy and contains several hundred billions of stars. The right and the left image are made from the same observation, only the right image did have image processing where the weakest parts have been brought forward.
Four shots of the star 'Wolf 1346' in 4 colours of light. For this star, astronomers know exactly how much light is being emitted in each different colour band. Therefore, using these recordings, the sensitivity of the camera can be determined for these specific bands.
Last modified:11 January 2023 4.07 p.m.
View this page in: Nederlands