Overcoming fear of complex data through data-driven storytelling

In New Ways of Teaching, lecturers talk about their innovative, creative, and effective teaching initiatives. From unusual teaching methods to new technologies — anything is possible. How do these ideas arise and what impact do they have on students? This month: putting complex data into practice through storytelling.

How do you encourage HRM students to tackle complex data when their focus has primarily been on the human side of organizations? Dr Jacoba Oedzes and Dr Stefan Berger, assistant professor and associate professor in Human Resource Management & Organizational Behaviour, respectively, came to the conclusion that many of their students are apprehensive about data analysis. That’s why they devised a way to take the edge off in their HR analytics course, teaching students how to do: ‘data-based storytelling’.

The bigger picture
‘Data-driven storytelling brings together two essential elements: data and storytelling — both of which are equally important. In our course unit, we teach a diverse group of students. Many of them initially feel uncertain about the technical side of data analysis, such as statistics, coding in R, and interpreting results. Our goal is to build their confidence in working with data while showing them that numbers alone are not enough.’
‘To have an impact within organizations, data must be translated into clear and meaningful stories. This goes beyond simply describing results. It means creating a strategic narrative with a clearly defined purpose, aimed at a specific audience. Whether it’s convincing an HR director to respond to a trend in staff turnover or helping a management team identify patterns in workforce diversity: data-driven storytelling helps students turn insights into action.’
Out of the comfort zone
‘When designing the HR Analytics course, we had two core objectives in mind. First, we wanted students to overcome their fear of data. Many feel intimidated by technical tools such as the programming language R or statistical analysis. This is why we focus on building their confidence by showing them that, with the right support and structure, they are fully capable of learning and applying these skills. Our aim isn’t just technical competence, but also self-efficacy in using data-driven tools.’
Closing the gap
‘We believe that HR analytics is ultimately about putting numbers into practice. That is why a large part of the course unit focuses on realistic practical situations. We drew inspiration from practical examples in HR and business analytics and developed a method that teaches students not only how to perform thorough analyses, but also how to present their findings effectively. In real organizations, decisions are not left to the data analysts alone. Analysts need to communicate their insights clearly and convincingly to managers, administrators, and stakeholders—most of whom don’t speak the language of statistics. This is where storytelling comes in: a bridge between technical insight and strategic decision-making.’

Hands-on learning
‘The HR Analytics Project Life Cycle (see RforHR.com, Laughlin, 2024) forms the core of the course unit; a structured process that mirrors how data-driven projects unfold in real organizations. By following this cycle step by step, students gain a deeper understanding of how analytics are actually used to solve problems in the workplace. Each step of the cycle is covered in a special tutorial or seminar, designed with an active learning approach. Students first work on practical challenges using real-world data, allowing them to apply concepts as they learn. Each session then concludes with a theoretical reflection, allowing students to link their hands-on experience to broader academic and professional insights. This structure ensures that learning is both practical and grounded in academic understanding.’
The grand finale
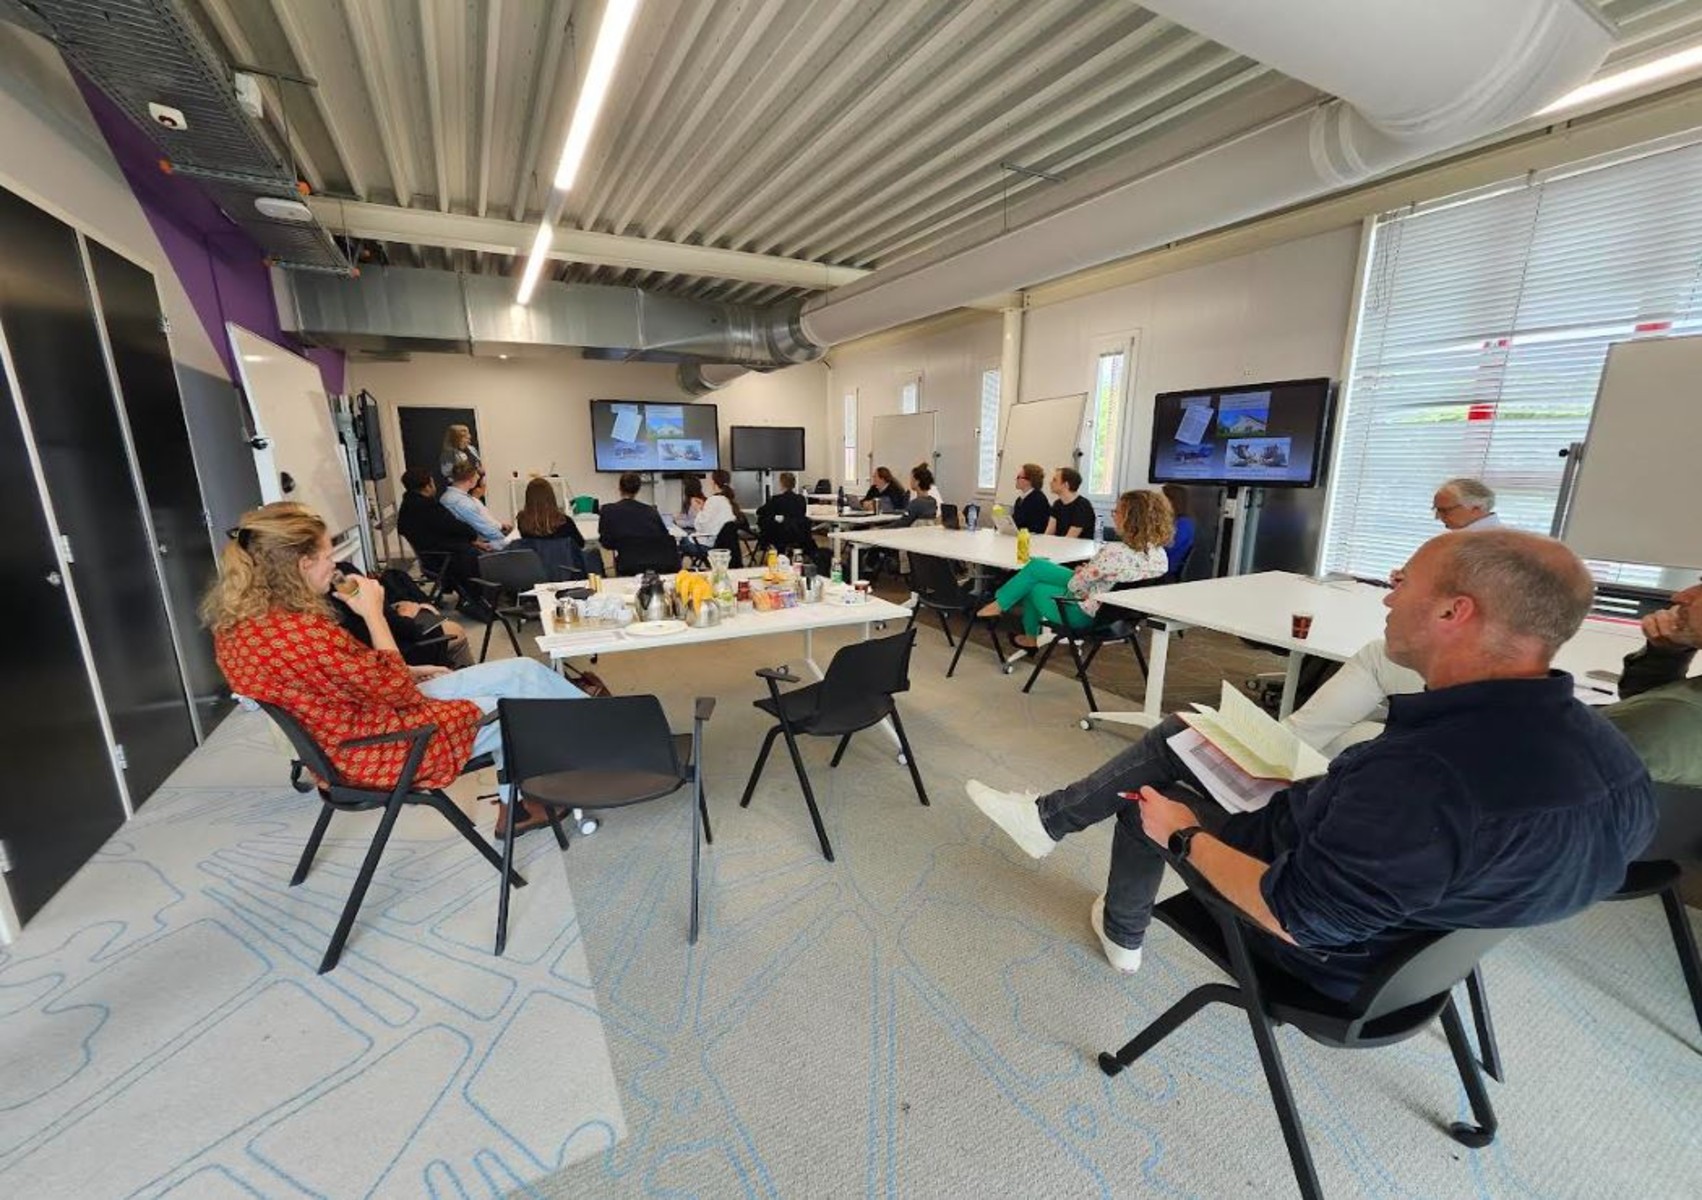
‘The course concludes with the HR Analytics Symposium, where students present their insights to actual HR professionals who play the role of the board of directors of a fictional organization. This session simulates a high-stakes organizational setting, where students defend their work and respond to critical questions. To increase the interaction between practitioner and student, the event also includes a panel discussion on the latest developments in HR analytics and it concludes with a networking reception.’
Glowing testimonials
‘In the most recent student evaluations, our HR Analytics course unit received an excellent average score of 4.7 out of 5.0, placing it among the top five highest-rated course units at the Faculty of Economics and Business. The testimonials from students demonstrate their enthusiasm and show that we are achieving our main objectives: “This course is incredibly well-designed for students with no programming experience, making it easy to get started”. Another student said “By inviting professionals from the business world to be the judges of our final project, we gained valuable insights into what is expected of us in the workplace. I absolutely enjoyed this well-designed and engaging course!”.’
Finding your way through a maze of data
‘Data-driven decision-making is becoming increasingly important in all sectors. This shift is particularly evident in HR. Companies use analytics to better understand the wellbeing of their staff, reduce staff turnover, develop fairer recruitment procedures, and align their talent strategies with their business objectives. But while the demand for data-savvy professionals is growing rapidly, many organizations admit they are not yet fully prepared for this. They often lack the internal expertise to turn raw data into strategic insights. That’s where our students come in. By guiding them through the entire HR analytics cycle—from formulating smart questions to communicating results convincingly—we not only teach them how to use the tools, but we also fill a skills gap. Our graduates have the ability to connect analytics and action, helping organizations to make smarter decisions. In a world flooded with data but scant clarity, that’s a skill that truly matters
More information
More news
-
15 September 2025
Successful visit to the UG by Rector of Institut Teknologi Bandung
