Komplot 8.2
What is Komplot?
Komplot is a X-Y graphing system with special features for scientific and engineering applications. A graph-style according to the rules of the "Physical Review", a logarithmic X-axis, vertical and horizontal errorbars, detailed control over axis lay-out and scaling numbers and automatic computation of scale-numbers are these features, that make Komplot often more suitable for scientific graphs than most of the popular PC graphing programs. So, if you are a programmer who wants to make scientific X-Y graphs of data generated by C/C++ or fortran-77/fortran-90 application programs, Komplot may be a good choice for you.
Komplot routines
Komplot 8.2 is for C/C++ and fortran programmers. Due to a careful choice of default values and the addition of 'graphical intelligence', only a few Komplot-routines with meaningful names are sufficient to program a complete X-Y-graph.
Firstly, you call frame to draw an axis-system with annotation in standard lay-out and, moreover, to define a mapping of the data-coordinates to the axes. Both linear and logarithmic axes are possible. Adding a minus-sign to the parameter specifying the axis length will make the axis logarithmic.
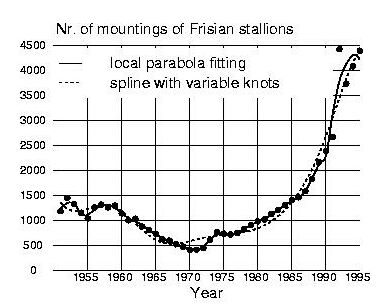
Then, data specified by a series of (X,Y)-coordinates can be visualised by various data-plotting routines such as polyline or curve to plot a smooth interpolated curve. Data points can be marked with a symbol by the routine markers. Data specified by a function F(X) can be visualized by function plotting routines (only in fortran). Every data visualisation routine plots a label in the legend as a description of the data. The scaling of the frame axes can be computed automatically from the (X,Y)-coordinates. A next call to frame starts a new graph.
The few routines mentioned thus far, are sufficient for a lot of practical applications. However, in order to publish a graph, often some changes has to made to the standard lay-out. Komplot has a lot of routines for this purpose, for example frame_style and scale_annotations. Further, extra strings and numbers can be plotted in the graph. Several fonts are available. Simple formulas with subscripts, superscripts and Greek characters can be plotted. Graphs can be overlayed to form complete new graph types, e.g. with various axis types.
Several examples illustrate the features of Komplot.
Output devices
Graphical output is produced in two or three steps. Firstly, Komplot-routines like frame and curve generate a (readable ASCII) intermediate file, with default name komplot.tmp. This file has to be postprocessed in step two by the program komplot to make the graphs visible. The program can be started by the shell script 'komplot' with three parameters with default values:
komplot [IDEV [plotfile [intermediate file]]]
Or by a call to the routine KOMPLOT(IDEV, plotfile) (in C/C++: komplot(idev, plotfile);) in the application program. The integer parameter IDEV specifies the output device:
-
IDEV=1 Tek Mode
-
IDEV= 40 PostScript laser printers, several PostScript attributes can be changed
-
IDEV= 50 Encapsulated PostScript (can be imported in Latex), several attributes can be changed.
More details are here.
History of Komplot
Komplot is developed at the Computing Center of the University of Groningen by Jan Kraak from 1970 on, supported by many collegues. The very first version, written for algol-60 programmers at the Telefunken TR4, dates from 1970. This was an algol-60 adaption of the American fortran program Simplotter. In 1975 a portable fortran version was made, the Computing Centre of the University of Utrecht (ACCU) assisted in the conversion. This version became widely used, not only at Dutch university mainframes but also at many other computer centres with a lot of different computer types.
Most of the current Komplot functionality was already available in this version, however driver technology was added in later versions. The first unix version with a X Window driver (written in C by M. Breeman, University of Groningen), as well as the local GEP graphics library with al lot of device drivers, date from the late eighties.
In the eighties much effort was invested in the user interface of Komplot. This resulted in the menu and command driven program Grafiek which is still available for version 7.0. The development of Grafiek is stopped from version 8.0 on. Presently, Komplot is like as it was in 1970: a graphing system only for programmers. As mentioned above, this new version has an improved collection of graphing routines with meaningful names instead of numbers. Another important new feature was the web-documentation. For a specific application the PostScript functionality was improved.
Download
Follow the installation and download instructions to get Komplot running on your linux system.
Revision information
Changes in version 8.2, December 2004:
-
improved installation procedure for LINUX (usable with a few adaptions for other platforms like SGI, Cray, ...)
-
All graphing routines available for C/C++.
-
Colour in PostScript.
-
Improved fortran-90 routines (not yet fully adapted).
Changes in version 8.1
-
deleted some implementations for obsolete platforms
-
removed X-Window driver (Other device drives still exist, but are not visible in de Komplot device menu, like the HPGL-driver for IDEV=10)
-
addition of the LINUX installation from source code
Changes in version 8.0
-
complete new set of routines. Download a complete set of source and html documentation if you really need this old version