
Big historical data: a gappy mess

We live in datafied times– times in which we are used to having an overload of information about any individual, place or event. Today’s data deluge shows an extraordinary capacity to store, retrieve and elaborate information. With digitization, people have not only become skilled at gathering present-day information, but also at retrieving and converting historical data. Historians have joined in on this digital wave– albeit in their own way: while most historical information is not ‘born-digital’, it surely is, can, or will be, digitized.
Although historians are not usually trained to use Big Historical Data*, historical research can benefit from it. By its sheer volume, big data brings (back) into history parts that were excluded before, and can thereby give a deeper understanding of the past. It might even play a part as a destabilizing power– after all, it is not bound by nation-states and corporations– and creates possibilities to research trends and ideas with more attention to suppressed voices, as Guldi and Armitage envision in The History Manifesto (2014). Optimistic minds promise us gold mines, incredible wealths of information that only need digitization, and with the digital tools and the applications that are now so easily available, unprecedented insight of the past is ours…. if we just apply them. It is true we see many historical materials like books and objects being caught in ones and zeros, often available without too much restrictions for anyone interested. Historical data, however, can be overwhelmingly gappy. Looking for the goldmines to test your ambitious hypotheses on, you will soon find that sources (i.e. data) are lost, destroyed or have never been created at all. And if they do exist, they are more often than not scattered, fragmented and heterogenous. We learn about the past through what has been handed down, most often through a handful of historical sources we know as the canon. Many fragments can never be restored and the further we go back, the greater the gaps become and the greater the uncertainties of our historical past. And even if we get our hands on a large quantity of information, traditional methods fall short when we try to make sense of it.
Tempted by the promises but confronted with the limitations, why would we use Big Historical Data? What problems can we run into? What do we lose- and, more importantly, what do we (hope to) win?
There is a certain attractiveness in gaps: the unknown waiting to be discovered. With today’s means we might actually be able to uncover new truths about the past, even if much is lost. Big data research is appealing because it uses the quantity of data to build a new narrative, whilst also capturing more of the complexity of the times:
“With more data, in practical terms, there is arguably a higher likelihood that historical narratives will be closer in accordance with past events, as we have more traces to base them on. But this is not certainty. History is not merely a reconstructive exercise, but also a practice of narrative writing and creation.” (Graham et al., 32)
Having only fragmented traces of the past never stopped historians from doing research in the first place, but the story we tell changes when we apply methodology and tools designed for a more macroscopic research. The macroscope is characterized by its use of large quantities of data, so what we gain is the option to quantify, and with that the possibility to measure: we quantify X, so we can measure Y. This procedure, however, requires previously unprocessed, ‘raw’, archival material to be formalized, put into categories, because these are the data to be used for measurements. Although essential for macroscopic research, this stage makes some historians uncomfortable. The immediate objections are that we will fail to capture the unique value of the source and that we simplify contents to a fixed number of categories by capturing it in rows and columns. The traditional approach focuses on the richness and wealth of a single source or a handful of sources and this is something we indeed, to some extent, lose, when we turn to the bigger and quantified picture. That being said, the micro-histories are never entirely lost, because the ones using a macroscope can (and often will) go back to a source to deepen our understanding of some statistical result. The fact that there are often gaps in the information makes it all the more important that historians necessarily put the data in context and give meaning to the numbers. Because of this, more often than not macro- and microscopic approaches are used side by side. As Lemercier and Zalc (2019) say: “any source can be quantified, but any quantification will not do”. Luckily, putting information in context is what historians usually know how to do, as this is no different from traditional research. Big data just allows us to apply more rigid methods to test hypotheses or point towards important factors. Patterns or structures are signaled bottom-up, which makes the results more reliable in a sense: it was a disinterested algorithm that highlighted a certain event or person, not the researcher with a preconceived idea of what they believe is (or should be) important.
Still, data never speaks for itself. Not when you have everything you need, and even less so if your information is fragmented. As historical data is necessarily gappy and scattered, often not any one source will fulfill all needs, so we combine sources. At this point already, decision begins to play a role. Not only in the beginning, but throughout the entire duration of a research project, we constantly need to learn again and again how to examine sources in order to establish their suitability, comparability and representativeness. This process also includes decisions of scope and categories, and what statistical models to employ. Sometimes, the gaps become blatantly clear especially when you make decisions on how to shape your database with enough rows and columns to do some analyses: a gap is often simply a blank cell. Other times the gaps are less obvious, and yet they will be made apparent after you run some calculations or visualizations. Through an iterative process the data and the research need to be tuned again and again.
I can give two examples of dealing with fragmented and incomplete data from our own ongoing project, The Normalisation of Natural Philosophy, that shows both how the data can be limiting as well as foster new ideas. The first example is about literal gaps and inconsistencies of historical data, the second one about how we deal with major information gaps. By no means do these examples show all the problems you can run into when dealing with historical data, but it will give an idea of the particular ‘big historical data problems’ one can run into. Each project will certainly show their own singular peculiarities.
For our project, we are building networks of authors and publications of seventeenth- and eighteenth century natural philosophers. We use several bibliographic sources to collect our corpus and found clever ways of determining its representativeness - a topic you can write a book about in itself, or at least a poster and a blog-post, as you can see here**. The resulting corpus is showing many gaps and inconsistencies, as you can tell by a small selection of our data below:
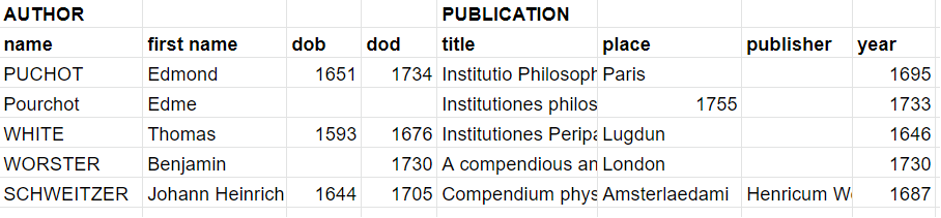
Despite all the wonderful tools and techniques available today, much of our work is still handy-work. Localizing the gaps is one thing, trying to fill them another. As you can see in the sample above, simply filling the blanks will not do. PUCHOT and Pourchot are the same person, 1755 is not a place, and Amsterlaedami and Lugdun are the Latin names for Amsterdam and, respectively, for Leiden or Lyon. Different spellings of the name of a person or a place, have to be observed, normalised and merged to a single standard- this will solve some gaps, such as the birth and death dates of Edme Pourchot and will remove his duplicate entry. For other gaps we can scour the internet, looking for reliable sources to draw information from. For these early modern works, we are sometimes lucky, since there are no more copyrights applying, and a freely available scan of a title page gives us much already.
Other times, gaps cannot be overcome, so we are left with blanks. This might be a terrible hindrance, but gappyness is the nature of historical data and in a way part of its value. Some gaps, for instance, can point towards outliers, indicating an interesting piece of information, exactly by its absence. Or, if we find a collection of works that are all missing the same information, does it suggest a trend in time? It is the quantity of data that makes it possible to notice these things.
Now suppose we encounter such a large gap, more cells in our neat spreadsheet are empty than filled in… does this make analysis impossible? I study the social relations of early modern philosophers, through their networks. For this I need (as you might expect) relational information. For the early modern period we have little to go on that indicates reliably whether our authors have been socially connected, except letter exchange. Using the available correspondences, some projects have reconstructed these social networks (a great example is Mapping The Republic of Letters). Although very informative, these available social connections do not help me much. The authors we have gathered for our project are mostly different from the authors whose letters have been documented. This is no surprise, as the outset of our research is very different: we aim to gain insight in the evolution of scientific knowledge by investigating teaching practices, not letter exchanges. While our authors might have been corresponding amongst each other as well, for most of them here is no letter remnants. Still, connections can be drawn in other, less obvious ways. To tie one person to the next, indirect information can offer a solution. Through environmental cues that are described in our author’s biographies, such as where they lived, taught or published, we can imagine a shared sociality, meaningful in its own way. By spinning a web of the possible past, we hope to reveal something about the actual past. Putting the data into context and going back and forth between the numbers and the sources is all the more indispensable now, since the data never fully speaks for itself.
We can gather additional data; terabytes, petabytes, exabytes of additional, preferably machine readable information, but historical data will always remain gappy. The boundaries of what we can do with it are as much limited by what is available to us, as by our creativity.
* What counts as ‘big’? There is no threshold by which data suddenly becomes ‘big data’. If the information becomes too much to read in a reasonable amount of time, or calls for computational involvement, we can start treating it as ‘big data’. This can range from a single book, an oeuvre to an entire library.
** And an article forthcoming (2021).
References:
- Lemercier, C., Zalc, C., & Goldhammer, A. (2019). Quantitative Methods in the Humanities: An Introduction. CHARLOTTESVILLE; LONDON: University of Virginia Press. Retrieved February 10, 2020.
- Graham, S., Milligan, I., & Weingart, S. (2016). Exploring big historical data : The historian's macroscope. London: Imperial College Press.
- Guldi, J and Armitage, D. History manifesto. Cambridge: Cambridge UP, 2014.