Service Catalog
The Geodienst offers a variety of services to students and staff of the university. Below you can find for each phase in research which services the Geodienst offers and supports. Do you need help with your research? Contact us!
Terms of use:
Collecting your data
Data Portal
The Geodienst has a data portal where you can find and download spatial data of The Netherlands. Examples are Key registration of Addresses and Buildings (BAG), Key registration Large-scale Topography (BGT) and Cadastral Parcels.
Open Data
Open data are free data resources that are available to everyone. There are several different data resources available on the internet. Take a look at ‘Geodata’ to find a list with often used data sources and datasets.
ArcGIS Online
ArcGIS Online is a complete cloud-based GIS mapping software. It enables you to connect data, locations and people by using interactive maps. Via rug.maps.arcgis.com you can access the ArcGIS Online portal of the UG. By clicking on ‘Sign in’ in the top right corner and logging in with your UG-account, you can access the software.
In ArcGIS Online you can find the Living Atlas, which has a collection of datasets, maps and apps. Next to this all kinds of data are added to the online environment by several parties, such as the UG. By searching the data you need in the search engine, the datasets that are available for you will show up.
Own data
Collecting Geographical Data
Collector app
Collector for ArcGIS is a simple way to collect accurate data in the field yourself and store it in a protected cloud environment in ArcGIS Online or Portal for ArcGIS. In this mobile app you can add and edit data via a webmap. This app also works when there is no internet connection available and it integrates seamlessly with the ArcGIS platform.
Qfields
QFields is Aan open source collector kind of app. Works in combination with QGIS. To use this you'll need to make a project in QGIS and configure a layer to your needs with the required attributes. In the app you can then add data points to the loaded project. Qfields will not online synchronise with your QGIS project. For online synchronisation we recommend to add QGIS Server.
QuickCapture
This tool is ideal to collect data on certain objects, such as the state of trees, or streetlights. Before you go into the field, you create a template online, which you can load in the smartphone app. In the field, you use the smartphone app, which works like a button board. Automatically GPS is recorded when you press a button.
Geographical surveys
Survey123
With Survey123 you can easily make surveys to collect data via web or mobile devices. It also works when there is no internet connection available. After collecting you can then share, analyse and upload the data. You can find Survey123 in the Geoportal of the UG by clicking on the nine dots in the top right corner. An overview of available applications will then appear.
Maptionnaire
Maptionnaire is a tool to take surveys that have a geographical approach. When using this tool, it is possible to for example let respondents point out a point or an area on a map. It is also possible to collect non-geographical data. First, you can view your data online, and it is possible to export the data as csv or shapefiles, to process the data in for example ArcGIS Pro. To be able to use Maptionnaire, you can create an account on new.maptionnaire.com (use your -@rug.nl or - student.rug.nl mail for this), and send an email to geodienst rug.nl
From analogue (historical) maps
Georeferencing and digitizating
Georeferencing means you are placing a non-digital map on top of a digital map. This is done by using matching points on the map. An example for old maps is for example church tower or fortifications.
Digitizating is to make data from a non-digital map. An example is to digitally draw in all the church towers that are visible on an old map. You can then place these objects on top of your current data.
Do you have a question about georeferencing or digitization? Send an email to the Geodienst and we will help you out!
Storing your data
ArcGIS Online
ArcGIS Online is a complete cloud-based GIS mapping software. It enables you to connect data, locations and people by using interactive maps. Via rug.maps.arcgis.com you can access the ArcGIS Online portal of the UG. By clicking on ‘Sign in’ in the top right corner and logging in with your UG-account, you can access the software.
You can store geodata for research and education within the ArcGIS Online environment. To provide access to and use secured researchdata the Geodienst can offer customized solutions on the RUG-infrastructure. Contact us for more information.
Local
You can store your data locally as long as you have enough space on your computer. Storing your data locally means you store it on your own computer. You can then only work with the data from your own computer, not from other devices.
Google Drive
In the university environment you have access to Google Drive. This is a cloud service where you can store and share your data. You have access to this data from any device.
Editing your data
QGIS
QGIS is a free open-source cross-platform desktop GIS application. With QGIS you can edit, analyse and visualize your spatial data.
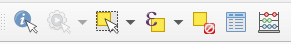
After uploading your data in QGIS you can easily edit your data. You can find several possibilities under the tabs ‘Vector’ and ‘Raster’ in the menu. Some of the most important tools are in the toolbar at the top of the screen.
(identifier, select by rectangle, select by expression, deselect, open attribute table, field calculator):
ArcGIS Online
ArcGIS Online is a complete cloud-based GIS mapping software. It enables you to connect data, locations and people by using interactive maps. Via rug.maps.arcgis.com you can access the ArcGIS Online portal of the UG. By clicking on ‘Sign in’ in the top right corner and logging in with your UG-account, you can access the software.
You can find many tutorials at the ESRI Academy to get you started with using ArcGIS Online.
ArcMap
Unfortunately, ESRI won't support ArcMap any more. If you need help with choosing a new application and/or moving your data, you can always e-mail us at geodienst rug.nl
ArcGIS PRO
ArcGIS Pro is the successor of ArcMap. It is a modern, fast and powerfull GIS application to analyse your data and make maps in 2D and 3D. You can download ArcGIS Pro via the UG downloadportal. The licence of this software is linked with your P- or S- number. When the download is finished, you can active the licence by logging in with your P- or S- number in the software itself.
You can find many tutorials at the ESRI Academy to get you started with using ArcGIS Pro.
Portal
Portal for ArcGIS is a flexible platform that runs on the UG infrastructure and therefore can be used totally secluded from the outside world to edit, analyse and visualize your privacy sensitive data. Send an email to Geodienst for more information.
Analyzing your data
QGIS
QGIS is a free open-source cross-platform desktop GIS application. With QGIS you can edit, analyse and visualize your spatial data.
A lot of the analysis tools are found in the standard QGIS package. Some tools that are not in the standard package can be downloaded as a plugin. You can do this via Plugins > Manage and Install Plugins .
ArcGIS Online
ArcGIS Online is a complete cloud-based GIS mapping software. It enables you to connect data, locations and people by using interactive maps. Via rug.maps.arcgis.com you can access the ArcGIS Online portal of the UG. By clicking on ‘Sign in’ in the top right corner and logging in with your UG-account, you can access the software.
You need credits to be able to carry out analysis in ArcGIS Online. For this reason the possibility for doing analysis is standardly turned off. As a university we do have credits available. In order to make use of these credits, you need to contact the Geodienst. We can then assign you a role with more authorizations. The button 'Analysis' will become visible. Here you can find many analysis tools.
ArcGIS PRO
ArcGIS Pro is the successor of ArcMap. It is a modern, fast and powerfull GIS application to analyse your data and make maps in 2D and 3D. You can download ArcGIS Pro via the UG downloadportal. The licence of this software is linked with your P- or S- number. When the download is finished, you can active the licence by logging in with your P- or S- number in the software itself.
Portal
Portal for ArcGIS is a flexible platform that runs on the UG infrastructure and therefore can be used totally secluded from the outside world to edit, analyse and visualize your privacy sensitive data. Send an email to Geodienst for more information.
Visualizing your data
QGIS
QGIS is a free open-source cross-platform desktop GIS application. With QGIS you can edit, analyse and visualize your spatial data.
After uploading your data into QGIS, it is automatically being visualized on a map. There are lots of possibilities to adjust the map to your own needs and taste. There are different basemaps available, you can change the symbology and colours and you can add visual effects, such as shadow and glows.
ArcGIS Online
ArcGIS Online is a complete cloud-based GIS mapping software. It enables you to connect data, locations and people by using interactive maps. Via rug.maps.arcgis.com you can access the ArcGIS Online portal of the UG. By clicking on ‘Sign in’ in the top right corner and logging in with your UG-account, you can access the software.
When you are loading your data and adding the layers, the data will be automatically visualized on an interactive map. Thereafter there are many possibilities to visualize your map, such as different basemaps, adjusting the symbology and colours, and adding visual effects, like shadows and glows.
ArcGIS PRO
ArcGIS Pro is the successor of ArcMap. It is a modern, fast and powerfull GIS application to analyse your data and make maps in 2D and 3D. You can download ArcGIS Pro via the UG downloadportal. The licence of this software is linked with your P- or S- number. When the download is finished, you can active the licence by logging in with your P- or S- number in the software itself.
When you are loading your data and adding the layers, the data will be automatically visualized on an interactive map. Thereafter there are many possibilities to visualize your map, such as different basemaps, adjusting the symbology and colours, and adding visual effects, like shadows and glows.
Story Maps
With Story Maps you can visualize your data in an easy way. Story Maps offers the possibility to combine maps with text, images and media content. This way you can communicate your story convincingly. You can find Story Maps in the Geoportal of the UG by clicking on the nine dots in the top right corner. An overview of available applications will then appear.
Insights
ArcGIS Insights is a web based data analysis tool. You can visualize your data in several ways in the dashboard, for example with maps, pie- and bar charts, and other graphs. The dashboard gives you an overview of all those different visualizations of the data. Since the tool is interactive, you can look for patterns in your data to gain new insights. You can find ArcGIS Insights in the Geoportal of the UG by clicking on the nine dots in the top right corner. An overview of available applications will then appear.
Webviewers
Web viewers can be build in different ways with open source solutions. An example is Leaflet, an open source Javascript library. The Geodienst has experience with building web viewers with Leaflet, but doesn't offer standard support for this. Do you need a customized solution? Please contact us!
Sharing your data
ArcGIS Online
ArcGIS Online is a complete cloud-based GIS mapping software. It enables you to connect data, locations and people by using interactive maps. Via rug.maps.arcgis.com you can access the ArcGIS Online portal of the UG. By clicking on ‘Sign in’ in the top right corner and logging in with your UG-account, you can access the software.
Story Maps
With Story Maps you can visualize your data in an easy way. Story Maps offers the possibility to combine maps with text, images and media content. This way you can communicate your story convincingly. You can find Story Maps in the Geoportal of the UG by clicking on the nine dots in the top right corner. An overview of available applications will then appear.
Portal for ArcGIS
Portal for ArcGIS is a flexible platform that runs on the UG infrastructure and therefore can be used totally secluded from the outside world to edit, analyse and visualize your privacy sensitive data. Send an email to Geodienst for more information.
Training and support
Geocoaching
Geocoaching is a personalized training meant for PhD students and staff. You can find the geocoaching course in the Corporate Academy and you can send a request to the Geodienst. A geocoaching course includes an intake meeting to determine your needs and current level of knowledge and several (bi-)weekly meetings with a Geodienst GIS specialist who provides you with training material and helps you with questions and your research.
QGIS Tutorials
On qgistutorials.com you can find several tutorials for QGIS. From beginner to expert tutorials, including python scripting for PyQGIS.
ESRI Trainings
Next to the software, ESRI also provides training. You can find these trainings in the Geoportal of the UG. After signing in with your UG account you can click on ‘Training’ in the account settings. You will be redirected to the ESRI Academy, where lots of trainings for ArcGIS are available.
Support
We offer support to researchers and students on a daily basis. Questions that came in via email, but also face-to-face during the walk-in hours. We help with small problems, such as questions about projections or which tools to use, but also with bigger matters, such as making a map or doing an analysis for a researcher. Check out 'Support' for more information.