Changing layout
Introduction
Several attributes of the lay-out of a graph can be changed by the routines described in this section.
Rules of use:- The routines must be called before
frame. Excepted are the routines that change atributes of the data visualisation, which must be called before the concerning routines. - Parameternames containing an X relate to the X-axis, same for the Y-axis.
- Dimensions are expressed in centimeters.
- The parameters L, LX, LY have the values 0 (false) or 1 (true).
- All parameters can be set back to their default value. Apply UNDO_CHANGES to undo all changes.
The use of these routines is illustrated in several examples.
Global
-
FRAME_STYLE(STYLE) - STYLE = 'scientific' (Physical Review), example STYLE = 'CBS'
STYLE = 'grid', with gridlines and legend in blanked-out area
STYLE = 'mathematic', axes with arrows at ends
STYLE = 'legend out', legend outside range of axes
STYLE = 'standard' (default) The style name can be in upper or lower case. -
SUPPRESS_BORDER(L) - L = 1 : suppress graph border. Mind that, when making a hardcopy, the dimensions of the graph do not change!
L = 0 (default) graph with border -
X_MARGINS(XM_LEFT, XM_RIGHT) - XM_LEFT = distance between the left-end of the X-axis and the border.
XM_RIGHT similar for right-end.
Defaults: XM_LEFT = XM_RIGHT = 2.0 cm. -
Y_MARGINS(YM_LOW, YM_HIGH) - YL_LOW = distance between the lower-end of the Y-axis and the border.
YL_HIGH similar for high-end.
Defaults: YM_LOW = YM_HIGH = 1.0 cm. -
CLIP_AT_AXES(L) - L = 1 : Data are clipped at border of rectangle defined by the axes.
L = 0 (default) : clipping at frame border.
Legend
-
GLAB_IN_TOP_LEGEND(L) - X_LOWER_LEFT and Y_LOWER_LEFT are the coordinates of the lower_left point of the first character of the first DLAB label of the legend. When X_LOWER_LEFT and Y_LOWER_LEFT are both set to 999.0 the coordinates are reset to their default position. When X_LOWER_LEFT equals 9999.0 you get DLAB's of combined graph's in one legend.
-
LEGEND_POSITION(X_LOWER_LEFT, Y_LOWER_LEFT) - L = 1 : GLAB in top line of the legend.
L = 0 (default) : GLAB in top of graph. -
LEGEND_IN_BLANKED_OUT_AREA(L) - L = 1 : DLAB data labels and the tags to the data are plotted in a blanked-out area. Data inside this area are clipped. The dimensions of this area are derived from the contents.
L = 0 (default) : no blanked-out area for legend. -
DLAB_FOLLOWS_DATA(L) - L = 1 : DLAB to the right of the last point of a data set (curve).
L = 0 (default): DLAB in legend.
Lines
The width and the grayvalue of PostScript lines can be defined by
PS_GRAPH_ATTRIBUTES (LW,GV)
-
LINE_TYPE_NR(IT) - This defines a line type number which is associated with: IT = pennumber at HP penplotters IT = colournumber for IDEV=2 Tektronix emulation
-
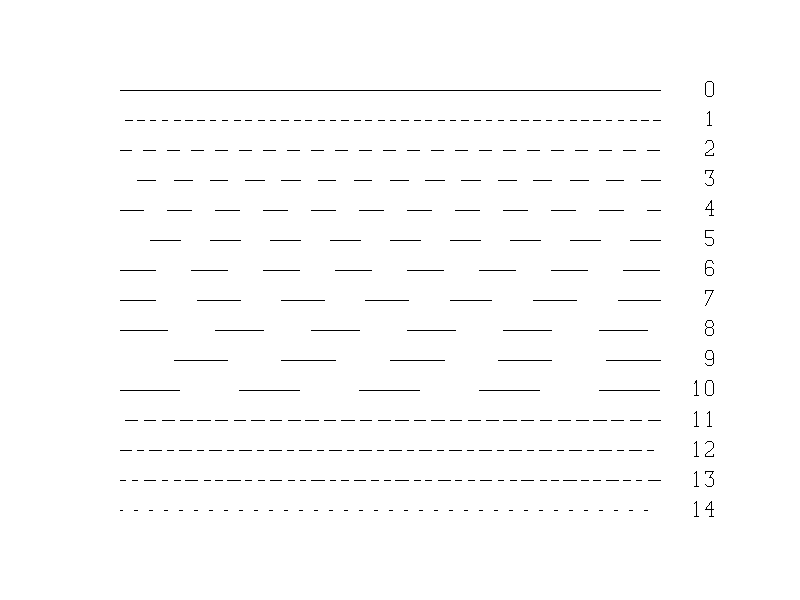
LINE_STYLE_NR(IS) - Sets the line style according the list in the tabel.
Scale
-
SCALE_DIMENSIONS(SF_ALL) - All dimensions of a graph are scaled (blown up or shrinked) with a scalefactor SF_ALL. Default SF_ALL is 1.0, 0.1<=SFA<=10.0 Assume SF_ALL is 1.0 in the description of the following routines
-
SCALE_ANNOTATIONS(SF_AN) - All annotations (labels and scalenumbers) are scaled with the factor SF_AN. Height of labels equals SF_AN*0.28 cm. Height of axisnumbers equals SF_AN*0.21 cm. Default SF_AN is 1.0, 0.1<=SF_AN<=10.0
-
SCALE_GLAB(SF_GLAB) - Height of GLAB equals SF_AN*SF_GLAB*0.28 cm. Default SF_GLAB is 1.0, 0.1<=SF_GLAB<=10.0
-
SCALE_MARKERS(SF_M) - Height of all markers of graph (except markers drawn with
VAR_SCALE_MARKERS) is SF_M*0.21 cm. Default SF_M is 1.0, 0.1<=SF_M<=10.0. Call beforeframe.
Axis-intersection
-
AXIS_INTERSECTION(X_INT_CM, Y_INT_CM) - X_INT_CM and Y_INT_CM are the coordinates of the intersection of the axes relative to their standard intersection (origin), expressed in cm. Default : X_INT_CM=Y_INT_CM=0.0
- AXIS_INTERSECTION_DU(X_INT_DU, Y_INT_DU)
- X_INT_DU and Y_INT_DU are the coordinates, expressed in data-units, of the intersection of the axes. X_INT_DU=Y_INT_DU=999.0 : back to default.
Ticks
-
TICK_DISTANCES(X_DIST, Y_DIST) - X_DIST is distance between ticks of linear X-axis and Y_DIST is distance between ticks of linear Y-axis. Default : X_DIST=Y_DIST=2.0 cm.
-
SUB_INTERVALS(NX_SUB, NY_SUB) - The distances between the ticks of a linear axis are devided in sub-intervals with 'small' ticks. NX_SUB is the number of sub-intervals of X-axis and NY_SUB is the number of sub-intervals of Y-axis. Default : NX_SUB is 1, 1<=NX_SUB<=10. Same for NY_SUB.
-
SUPPRESS_TICKS(LX, LY) - When LX equals 1 all ticks of X-axis are suppressed and the same holds for LY. By Default LX and LY are set to zero, no suppression.
-
REVERSE_TICKS(LX, LY) - When LX equals 1 all the ticks of the X-axis are reversed and plotted on the same side as the annotations. As a side-effect YM_LOW=YM_HIGH=1.5 cm, see Y_MARGINS. The equivalent holds for LY with XM_LEFT=XM_RIGHT=2.5 cm. By default LX and LY are set to zero.
Axisnumbers
-
FORMAT_X_AXISNUMBERS(NDX, NEX) - NDX : axisnumbers of a linear X-axis have NDX digits after the decimal point.
NEX : all axisnumbers must be multiplied by an overall-factor '10 to the power NEX', which is plotted after XLAB.
NEX = 0 : no overall-factor.
Default: NDX = 2, NEX depends upon the scaling numbers according to some internal algorithm. 0<=NDE<=7, -38<=NEX<=38 -
FORMAT_Y_AXISNUMBERS(NDY, NEY) - Same for axisnumbers of Y-axis.
-
Y_AXISNUMBERS_ROTATED(L) - L = 1 : axisnumbers of Y-axis in same direction as Y-axis.
L = 0 (default) : horizontal -
SUPPRESS_AXISNUMBERS(LX, LY) - LX = 1 : suppress axisnumbers of X-axis.
LY : same for of Y-axis. -
SUPPRESS_END_AXISNUMBERS(LX, LY) - LX = 1 : suppress the axisnumbers at the ends of the X-axis.
LY : same for Y-axis. -
AXISNUMBERS_BETWEEN_TICKS(LX, LY) - LX = 1 : axisnumbers of linear X-as are plotted between the ticks.
LX = 0 (default) : axisnumbers of linear X-as are plotted below the ticks.
LY : same for Y-axis.
Logarithmic axes
-
LOG_AXIS_WITH_358(LX, LY) - LX = 1 : The axisnumbers 3,5 and 8 are plotted below the concerning ticks of a decade with length >= 2.0 cm.
LX = 0 : Only axisnumbers (powers of 10) at decade-ends. LY : same for Y-axis. -
LOG_AXIS_WITH_COMPLETE_DECADES(LX, LY) - LX = 1 : Complete decades along logarithmic X-axis.
LX = 0 : partial decades.
LY : same for Y-axis.
Axes
-
REVERSE_AXIS_ANNOTATION(LX, LY) - LX = 1 : annotation and tickmarks on other side of axis. LX = 0 : no reversion, default. LY : same for Y-axis
-
SUPPRESS_AXES(LX, LY) - LX = 1 : suppress X-axis. LX = 0 : no supression, default. LY : same for Y-axis
-
SUPPRESS_AXISLINES(LX, LY) - LX = 1 : suppress X-axisline. LX = 0 : no suprresion, default. LY : same for Y-axis
-
CRACK_IN_AXES(LX, LY) - LX = 1 : 'crack' in first interval of linear X-axis. Instead of XLEFT, the value 0 is plotted at the left-end. LX = 0 : no 'crack', default. LY : same for Y-axis.
-
EXTRA_AXES(LX, LY) - LX = 1 : Additonal X-axis at the top of the Y-axis, with reversed ticks and no annotation. LX = 0 (default) no extra X-axis. LY : same for Y-axis.
-
MONTH_LABELS(IX, IY) - IX : X-Scalenumbers are replaced by (abbreviated) month-names (JAN, FEB, MAR,...), numbered respectively 1, 2, 3, ..., 12. IX = number of month-name of first tick on the right of the origin. The following ticks get mont-names corresponding to IX+1, IX+2, IX+3,... The month-cycle is repeated at the end. IX = 0 (default): no month-labels. IY : same for Y-axis.
-
YLAB_ABOVE_Y_AXIS(L) - L = 1 YLAB horizontally above Y-axis. L = 0 (default) : YLAB vertically along Y-axes.
Automatic scaling
-
ISOTROPIC_AUTOMATIC_SCALING(L) - L = 1 : Same increase in automatically computed scalenumbers (scale-factor) for both axes. Only for linear axes with the same tick distances.
L = 0 (default) : independent automatic scaling for both axes. -
NICE_NUMBERS(INICE) - INICE = 1 (default) nice numbers for automatic scaling: 1.5,2.0,3.0,4.0,5.0,8.0,10.0,15.0
INICE = 2 nice numbers for automatic scaling: 2.0,5.0,10.0,20.0 -
REVERSE_AUTOMATIC_SCALING(LX, LY) - LX = 1 : The automatically computed scalenumbers of the X-axis decrease from left to right.
LX = 0 (default) : axisnumbers increase from left to right.
LY : same for Y-axis. Both for linear and logarithmic axes! -
SUPPRESS_DATA_AUTOMATIC_SCALING(L) - L = 1 : the following data and function plotting routines do not contribute to automatic scaling.
L = 0 (default) : data of following routines contribute to automatic scaling.
Gridlines
Graphs with gridlines can be easily programmed withFRAME_STYLE('grid') and FRAME_STYLE('CBS'). The following routines give more control over gridlines.-
GRIDLINES(LX, LY) - LX = 1 : (major) X-ticks are extended in the Y-direction as gridlines.
LX = 0 (default) : no gridlines.
LY : same for gridlines of Y-axis. Both for linear and logarithmix axes! -
GRIDLINE_STYLE_NR(IX, IY) - IX = linestyle number of X-gridlines, see
LINE_STYLE_NR.
IX = 0 : standard line.
IY : same for Y-axis. -
GRIDLINE_TYPE_NR(IX, IY) - IX = linetype number of X-gridlines, see
LINE_TYPE_NR.
IX = 0 : same linetype as frame.
IY : same for Y-gridlines. The width and the grayvalue of PostScript gridlines can be defined byPS_GRID_ATTRIBUTES(LW,GV) -
EXTRA_GRIDLINES(NX_SUB, NY_SUB) - IX : The distance between two gridlines are divided in NX_SUB subintervals which define the extra gridlines.
IX = 1 (default) : no extra gridlines.
IY : same for extra Y-gridlines.
Blanked-out area
-
BLANKED_OUT_AREA(XLL, YLL, WIDTH, HEIGHT) - Instead of placing DLABs in the blanked-out area (see
LEGEND_IN_BLANKED_OUT_AREA), it is also possible to specify an arbitrary blanked-out area, in which strings and numbers are placed. Data inside this area are clipped at the border. (XLL,YLL) are the coordinates of the lower-left corner of the area with given width and height. >>> XLL = 999.0 : end of blanked-out area.
Fonts
-
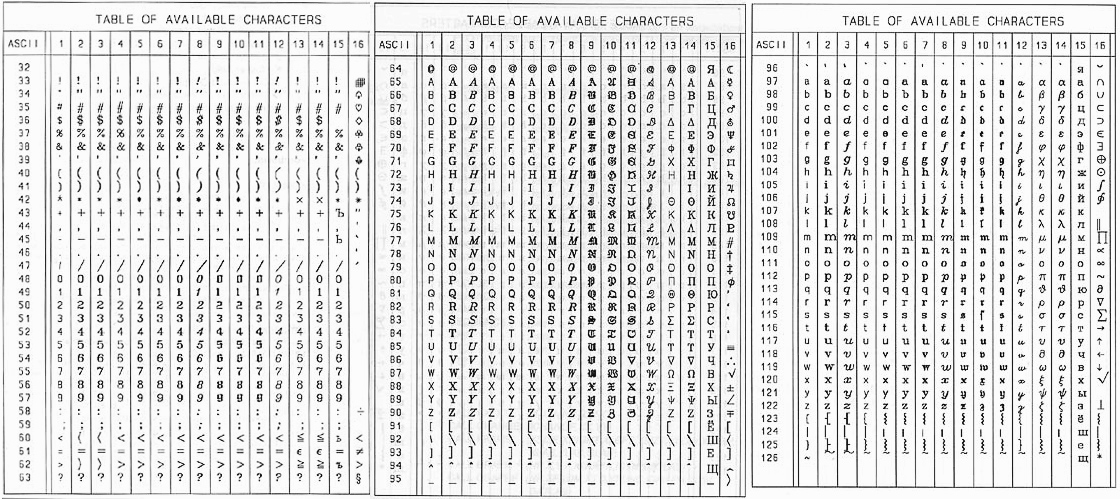
FONT_SWITCH_CHARACTER(CHAR) - Fonts are device dependent. Displays (IDEV=1,5) apply Hershey fonts, whereby characters are built from a sequence of strokes. KOMPLOT supports 16 Hershey fonts. Default is Hershey font nr. 1. Fonts can be changed by inserting a fontswitchcharacter CHAR followed by a fonttag (an uppercase letter in the range A..P) in a string of a Komplot-routine, whereby: A corresponds to font nr. 1, B corresponds to font nr. 2, C corresponds to font nr. 3, ... P corresponds to font nr. 16. Use font 13 for Greek characters, this is compatible with PostScript font M (Symbol). The fontswitchcharacter is default NOT DEFINED. The font definition remain valid for following text strings. Example: program test ... call FONT_SWITCH_CHARACTER('$') call FRAME(10.,0.,10.,10.,0.,10., +'one','$Btwo$Cthree','four$Afive') ... end PostScript printers (IDEV = 40, 50) use hardware characters. The following 13 fonts are defined at the beginning of the program: A Times-Roman, B Times-Italic, C Times-bold, D Times-bold-Italic, E Helvetica, F Helvetica-Oblique, G Helvetica-Bold, H Helvetica-Bold-Oblique, I Courier, J Courier-Oblique, K Courier-Bold, L Courier-Bold-Oblique, M Symbol (e.g. Greek characters)
Make sure that your PostScript printer/viewer supports these fonts! This corresponds to the following heading of the PostScript file: %!PS-Adobe- /CP { closepath } bind def /DF { scalefont setfont } bind def /F { findfont } bind def /FA {/Times-Roman F } bind def /FB {/Albertus F } bind def /FC {/Arial F } bind def /FD {/Times-BoldItalic F } bind def /FE {/Helvetica F } bind def /FF {/Helvetica-Oblique F } bind def /FG {/Helvetica-Bold F } bind def /FH {/Helvetica-BoldOblique F } bind def /FI {/Courier F } bind def /FJ {/Courier-Oblique F } bind def /FK {/Courier-Bold F } bind def /FL {/Courier-BoldOblique F } bind def /FM {/Symbol F } bind def ... The fonts corresponding to A..M can be changed byPS_DEFINE_FONT. Example:program test ... call FONT_SWITCH_CHARACTER('$') call PS_DEFINE_FONT('B','Albertus') call PS_DEFINE_FONT('C','Arial') call FRAME(10.,0.,10.,10.,0.,10., +'one','$Btwo$Cthree','four$Efive') ... endThis results in the following start of the PostScript file: %!PS-Adobe /CP { closepath } bind def /DF { scalefont setfont } bind def /F { findfont } bind def /FA {/Times-Roman F } bind def /FB {/Albertus F } bind def <....... /FC {/Arial F } bind def <....... /FD {/Times-BoldItalic F } bind def /FE {/Helvetica F } bind def <....... /FF {/Helvetica-Oblique F } bind def /FG {/Helvetica-Bold F } bind def ...
PostScript
-
PS_SIZES(PSXSZ, PSYSZ) - abs(PSXSZ) = maximal x-size (default 19.3) as defined by FRAME/CHANGE
PSYSZ = maximal y-size (default 27.9) as defined by FRAME/CHANGE
PSXSZ < 0 : isotropic fitting within A4, possibly with a rotation over 90 degrees useful for previewing purposes with Ghostview -
PS_OFFSETS(PSXOFS, PSYOFS) - PSXOFS = offset in X-direction (default 0.8 cm)
PSYOFS = offset in Y-direction (default 0.8 cm) -
PS_BACKGROUND(GVRGB) - GVRGB = grayvalue or color of background
GVRGB = (0..1) grayvalue, 0 : black, 1 : white (default)
GVRGB = (2..10) color specified by rgb (red-green-bleu)
GVRGB = 2 : red (r=1, g=0, b=0)
GVRGB = 3 : green (r=0, g=1, b=0)
GVRGB = 4 : blue (r=0, g=0, b=1)
GVRGB = 5 : r=1, g=1, b=0
GVRGB = 6 : r=0, g=1, b=1
GVRGB = 7 : r=1, g=0, b=1
GVRGB = 8 : r=0.5, g=0.5, b=1
GVRGB = 9 : r=1, g=0.5, b=0.5
GVRGB =10 : r=0.5, g=1, b=0.5 -
PS_DEFINE_FONT(TAG,FONT) - TAG = character in the range A..M
FONT = name of PostScript fontname associated with TAG
Defaults:
TAG/FONT
A Times-Roman
B Times-Itlaic
C Times-bold
D Times-bold-Italic
E Helvetica
F Helvetica-Oblique
G Helvetica-Bold
H Helvetica-Bold-Oblique
I Courier
J Courier-Oblique
K Courier-Bold
L Courier-Bold-Oblique
M Symbol (e.g. Greek characters)
Back to default : FONT = '***' -
PS_FRAME_ATTRIBUTES(LW,GVRGB) - LW = linewidth frame in cm, default LW = 0.02
RGBGV = grayvalue or color specification (seePS_BACKGROUND) of frame,
default GVRGB = 0.0 (black) -
PS_GRID_ATTRIBUTES(LW,GVRGB) - LW = linewidth gridlines in cm, default LW = 0.01
RGBGV = grayvalue or color specification (seePS_BACKGROUND) of gridlines,
default GVRGB = 0.0 (black) -
PS_GRAPH_ATTRIBUTES(LW,GVRGB) - PS-attributes of all Komplot routine calls after
frame
LW = linewidth in cm, default LW = 0.02
RGBGV = grayvalue or color specification (seePS_BACKGROUND),
default GVRGB = 0.0 (black)
Superposition of graphs in a page
-
PAGE_DIMEMSIONS(XS, YS) - Next graphs within one page, with position within page defined by
SHIFT_FRAME_IN_PAGE.
XS = X-length of page in cm.
YS = Y-length of page in cm. -
SHIFT_FRAME_IN_PAGE(XSH, YSH) - XSH = X-position of the lower-left point of the frame border relative to the origin of the page (= lower-left point).
YSH = Y-position of the lower-left point of the frame border relative to the origin of the page (= lower-left point).A
FRAME-call without precedingSHIFT_FRAME_IN_PAGE-call ends the superpositioning of frames in a page.
Last modified:04 October 2024 12.41 p.m.