Information visualisation
"A picture is worth a thousand words."
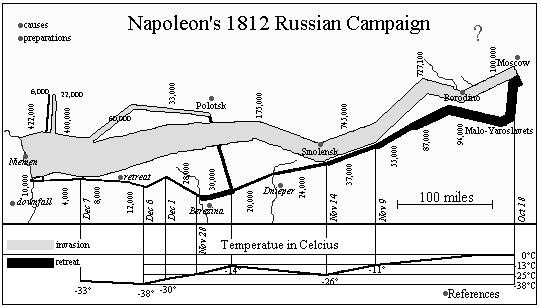
We have all experienced the contrast between hearing (or reading) a description of a person's face, as opposed to seeing a picture of the same face. The picture instantly conveys information to our minds which allows us to recognize a familiar individual. The narrative description may never convey enough information to arrive at the same conclusion. This ability of the human mind to rapidly perceive certain types of information, makes information visualization a useful and often necessary tool. Information Visualization is a highly efficient way for the mind to directly perceive data and discover knowledge and insight from it.
Information Visualization is the direct visualization of a representation of selected features or elements of complex multi-dimensional data. Data that can be used to create a visualization includes text, image data, sound, voice, video - and of course, all kinds of numerical data. Our visual analysis systems also provide the tools to interact with the data that has been visualized so that users can explore, discover and learn. Users do not look at static images, but can subset the data, run queries, do time sequence studies and create categories and correlations of data type.
Above quote is from the PNNL-website, one of many interesting websites about information visualization.
Another quote from a call for participation of the IEEE Information Visualization conference 2004:
Computer-based information visualization, or "infovis", centers around helping people explore or explain data through systems that include static or interactive visual representation. The central design challenge in infovis is designing a cognitively useful spatial mapping of a dataset that is not inherently spatial. There are many possible visual encodings, only a fraction of which are helpful for a given task. We draw on the intellectual history of several traditions, including computer graphics, human-computer interaction, cognitive psychology, semiotics, graphic design, statistical graphics, cartography, and art. The synthesis of relevant ideas from these fields is critical for keeping pace with the torrents of data that confront us all.
Three Pictogram papers in Dutch about Information Visualisation
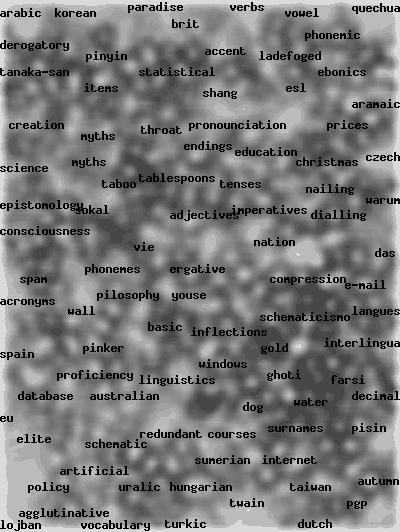
- Visualisatie van documenten - voor de dolende Web-speurder , about Kohonen's Self-Organizing Map (SOM) algorithm from the theory of neural networks. The goal is to discover by unsupervised learning some underlying structure in data.
- Informatie-visualisatie met treemaps , about the application of SequoiaView, botanical trees etc.
- Waarom werkt informatievisualisatie zo goed?
Tutorials
- Neural networks, by Genevieve Orr
- See the course description of Scientific Visualization, by Jos. B.T.M Roerdink
Other links
- Datamining in 3D for genomics research can be done with SARAgene, that is installed in the Reality Centre.
- Mineset, software for data-mining and visualization.
- A Data-Code-Compute Resource for Research and Education in Information Visualization.
This web site provides access to different software packages easing the exploration, modification, comparison, and extension of data mining and information visualization algorithms. Diverse software packages were bundled into learning modules. Links to diverse databases, compute resources, and references are provided as well. It is our hope that the community will adopt this resource to foster Information Visualization education and research. This site is work in progress. A very first version was released at IEEE InfoVis in October 2003.
Table of Information Visualisation Conferences