Onze Expo
Science LinX verbindt en betrekt leerlingen, docenten, maatschappij en breed publiek: door wetenschap een podium te bieden, brengt het de vonk, passie en het enthousiasme voor wetenschap en engineering van de Rijksuniversiteit Groningen over. Met een frisse op-maat benadering, faciliteert Science LinX continu leren over grenzen van wetenschap, onderwijs, werk en maatschappij.
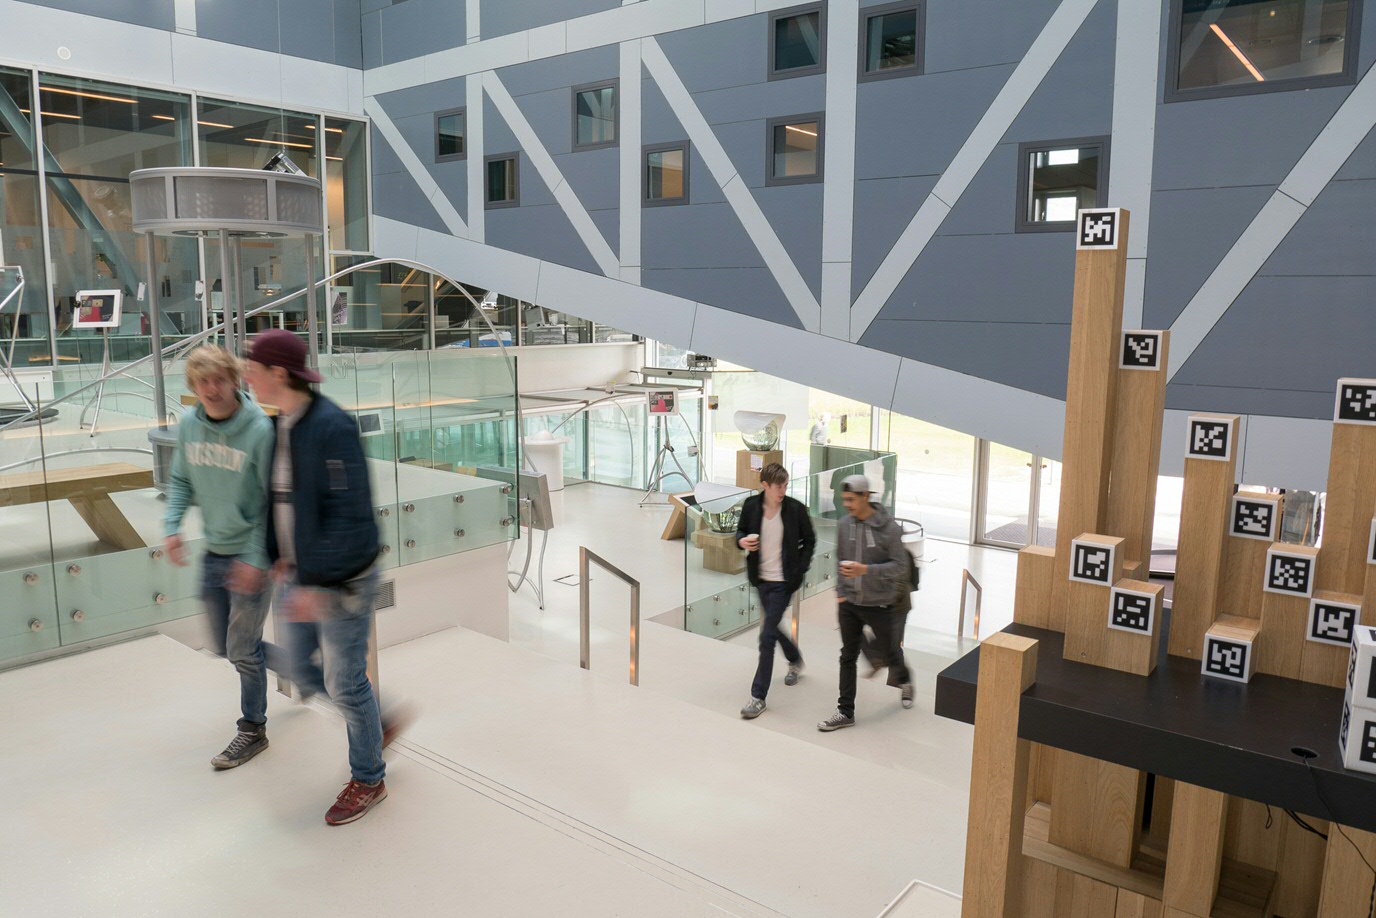
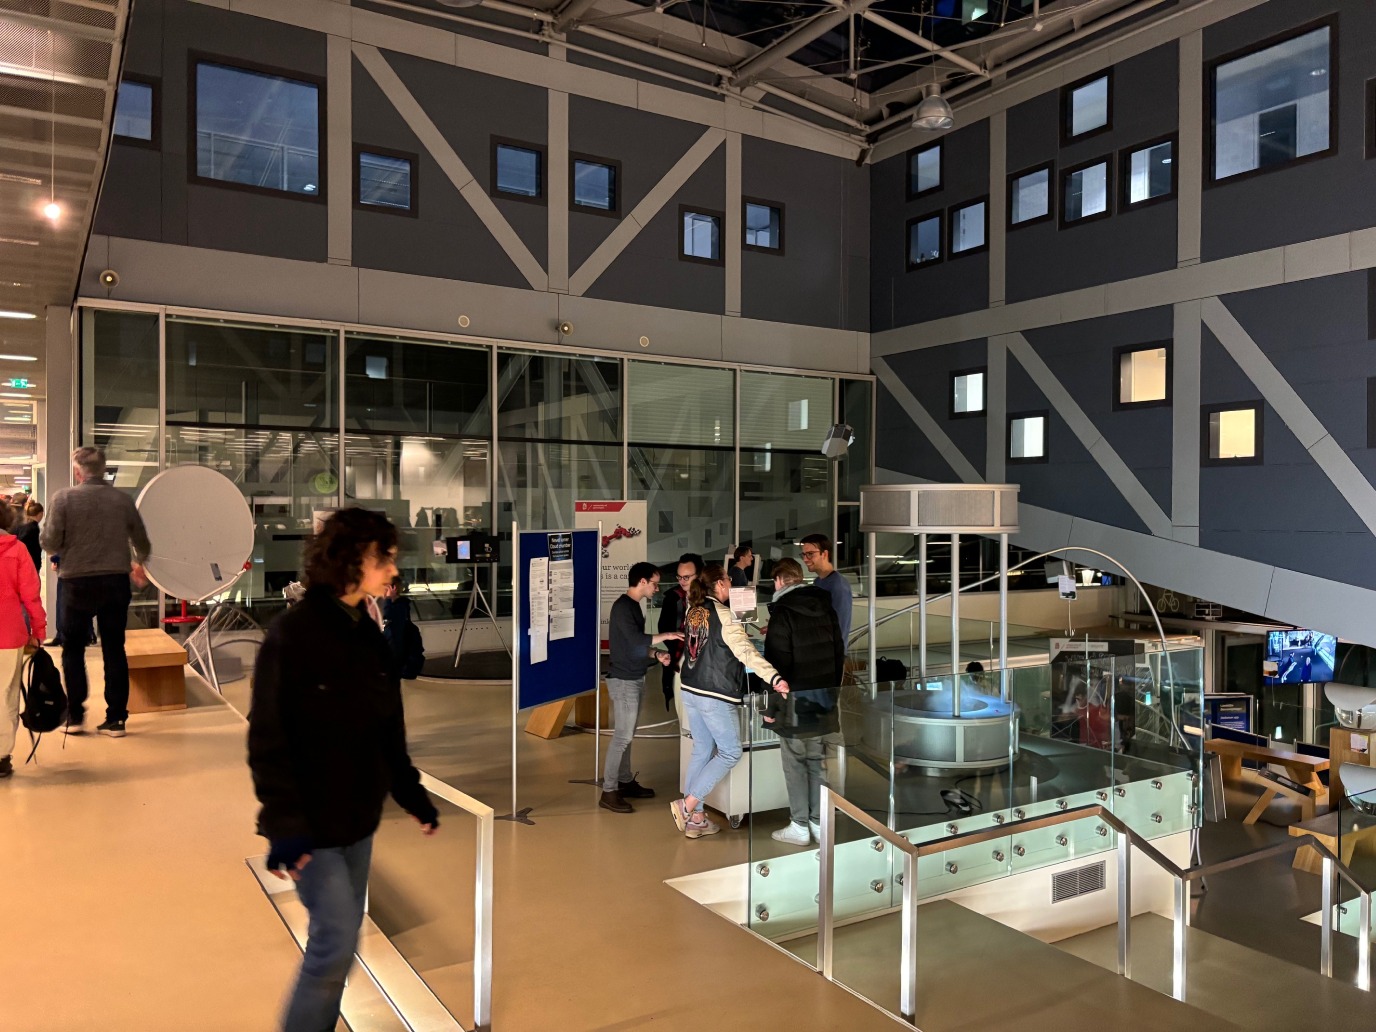
Zie het onzichtbare bij Science LinX. Bezoek onze expo, projecten en festivals en zoek jouw ideale bètastudie. Met onze opstellingen, games en visualisaties maak je kennis met de natuurwetenschappen en technologie, en het baanbrekend onderzoek uit onze labs.
Vraag nu een rondleiding aan onze vaste expositie in de Bernoulliborg op het Zernike. Speel daar een potje MindBall, waar de meeste relaxte speler wint... maak aminozuren met het Riborad… of blaas onze tornado weg… Ook kun je de expositie RE:charge in de Energy Academy bezoeken, over jouw persoonlijke energielabel. Ontdek hier hoe het gebouw de vier elementen benut, zonder gebruik te maken van veel technologie.
Bij ons Bètasteunpunt kun je terecht met vragen over je profielwerkstuk.
Neem contact op via sciencelinx rug.nl voor een rondleiding, vragen of ideeën voor exposities.