Satellite identifies bird-friendly meadows
New, radar-based satellite observations are enabling researchers to gauge how intensively areas of grassland are being used. Satellite images of agricultural landscapes can now be used to determine the suitability of a specific meadow for meadows birds such as the black-tailed godwit. Dr Ruth Howison and fellow-researchers from the University of Groningen ( GELIFES ) developed these new methods. Their research was published in the Journal of Applied Ecology on 17 January 2018.
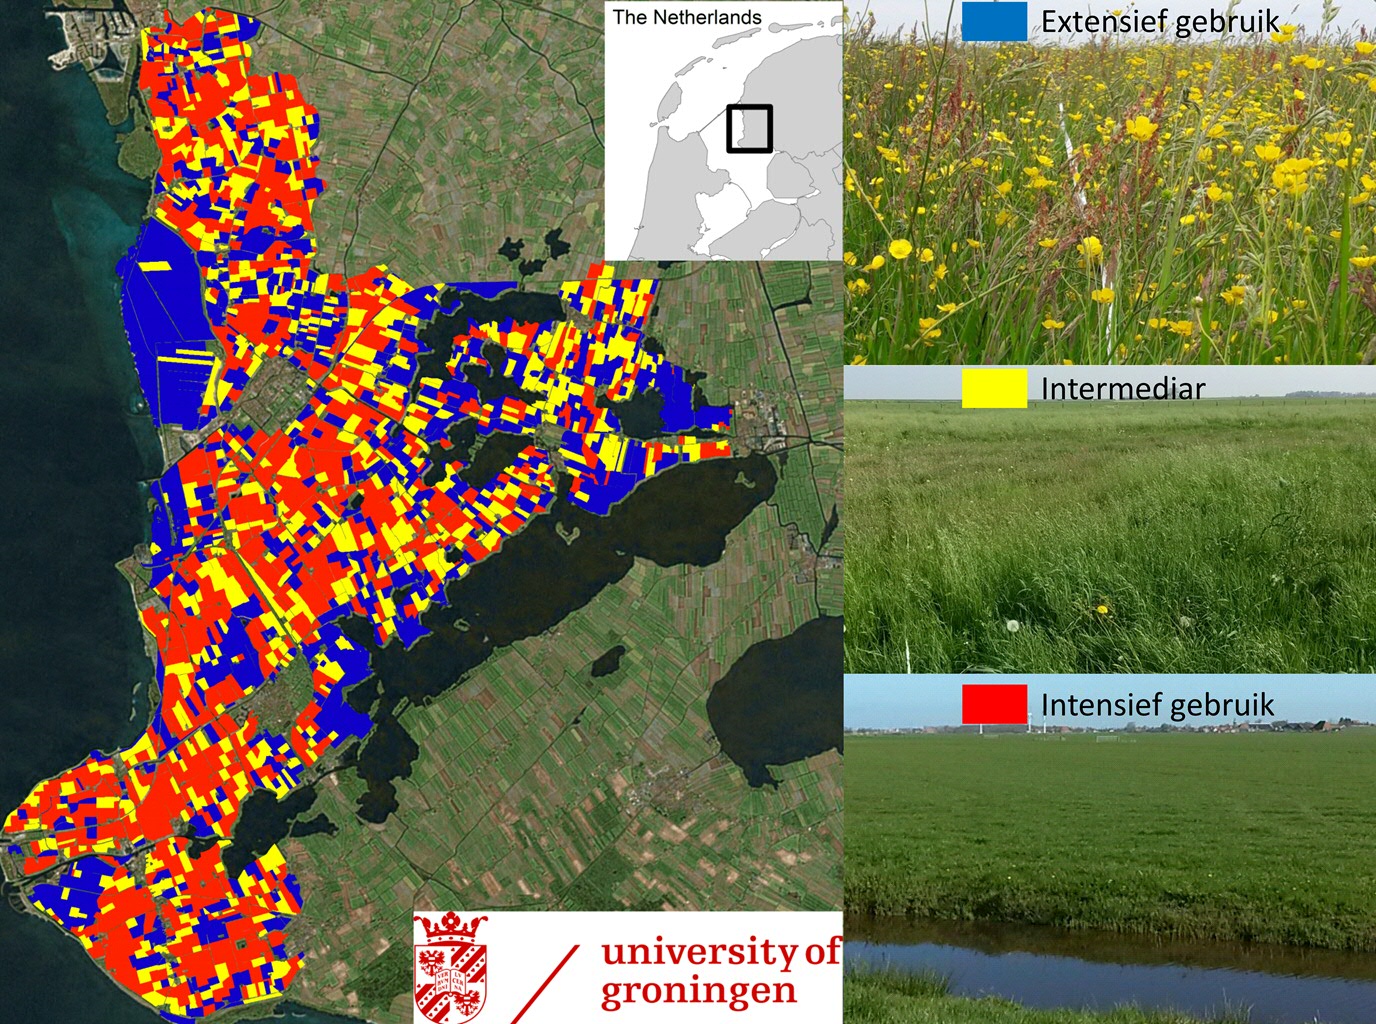
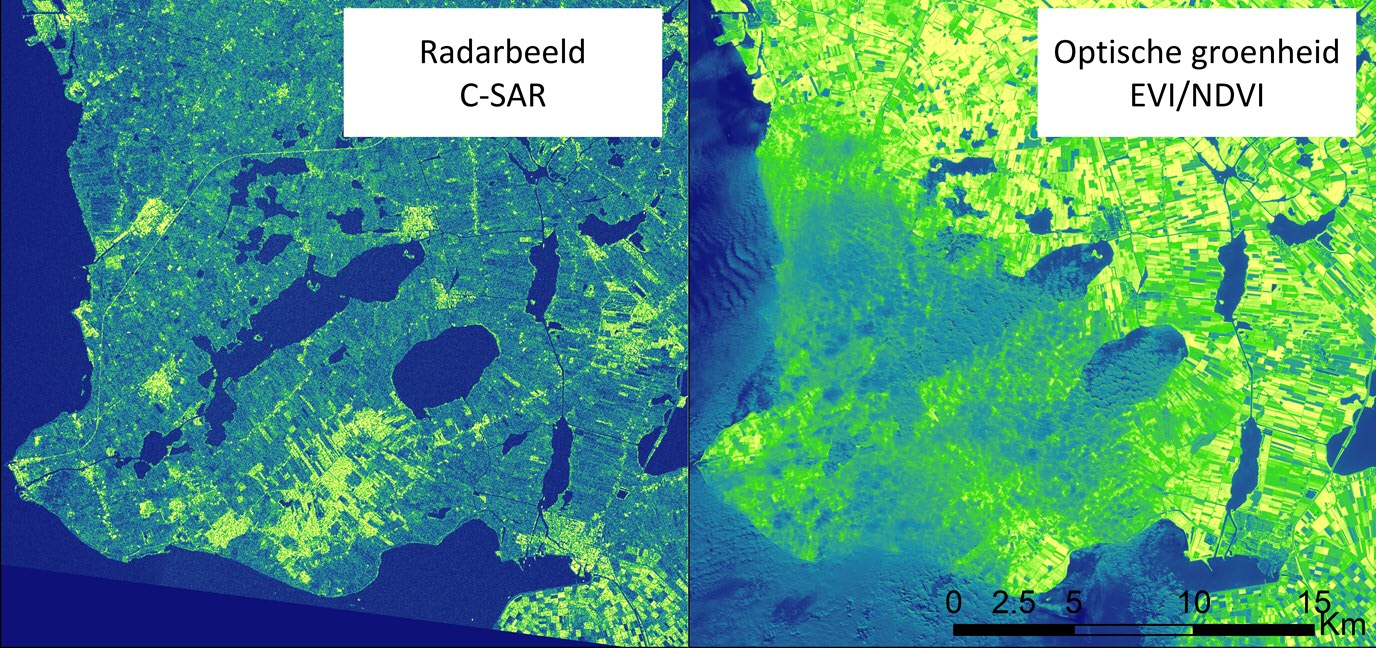
The researchers used repeated measurements generated by the Sentinel-1, a new ESA satellite system, to see how fields and meadows change in spring. This satellite system measures the structure (height, density) of the vegetation. The measurements are so precise that they can ascertain the growth of grass in individual meadows. If the satellite image shows little change in a particular field, it is usually because the field is being used extensively. Fields that show a lot of change in the vegetation structure turned out to be fields that are used for intensive farming, where the grass grows quickly and is mown every four weeks. The satellite also identified an intermediate group, where a delayed mowing policy is deployed or which is used by large grazers.
New satellite looks through the clouds
For their research, Howison and colleagues analysed data from the European satellite, which has been using what is known as a short-wave infrared radar to scan the Earth’s surface since 2015. ‘Satellites have been able to identify the volume of ‘green’ on the Earth’s surface for some time now’, explains Howison, ‘but their observations were sometimes impeded by cloud cover. This modern radar can ‘look through the clouds’. So it can record images of the same piece of land every 12 days, whatever the weather. The images are detailed enough to be able to identify different areas of meadowland with long and short grass, for example.’
Good for the black-tailed godwit
Howison then compared the analyses of intensive or extensive land use, as identified by the satellite, with distribution data about the brooding habits of the black-tailed godwit. ‘It appears that our national bird prefers the intermediate group of extensively managed fields for brooding. The areas of land designated as ‘for intensive use’ by the satellite are their least favourite place to brood. We have therefore shown that the satellite ‘knows’ the difference between bird-friendly managed grasslands and land that is too intensively managed.’
Large-scale measurements
The satellite’s measurements show that it is possible to make a large-scale reliable analysis of the intensity of land use, even in less accessible areas such as Russia or China. ‘At a time when discussions about the decline of biodiversity in agricultural areas are rife, it’s important to monitor land use systematically and on a large scale’, says Howison. ‘The data gathered by this satellite could make a great difference in this respect.’
Note for the press:
For more information, please contact:
- Dr Ruth A. Howison, Post-Doctoral Researcher Conservation Ecology (RUG/GELIFES): tel. +31 (0) 617453673
- Prof. Han Olff, Professor of Ecology (UG/GELIFES): https://www.rug.nl/staff/h.olff/
- Jorien Bakker, UG spokesperson, tel. +31 (0)50 3635328 / +31 (0)6 11800452, e-mail j.a.bakker@rug.nl
More news
-
-
15 September 2025
Successful visit to the UG by Rector of Institut Teknologi Bandung
-