
Journal of Regional Science
| Figures and Tables are taken from the following paper: |
|---|
| Los, B., Timmer, M. P., & de Vries, G. J. (2015). How global are global value chains? A new approach to measure international fragmentation. Journal of regional science, 55(1), 66-92, DOI: 10.1111/jors.12121 |
Figures
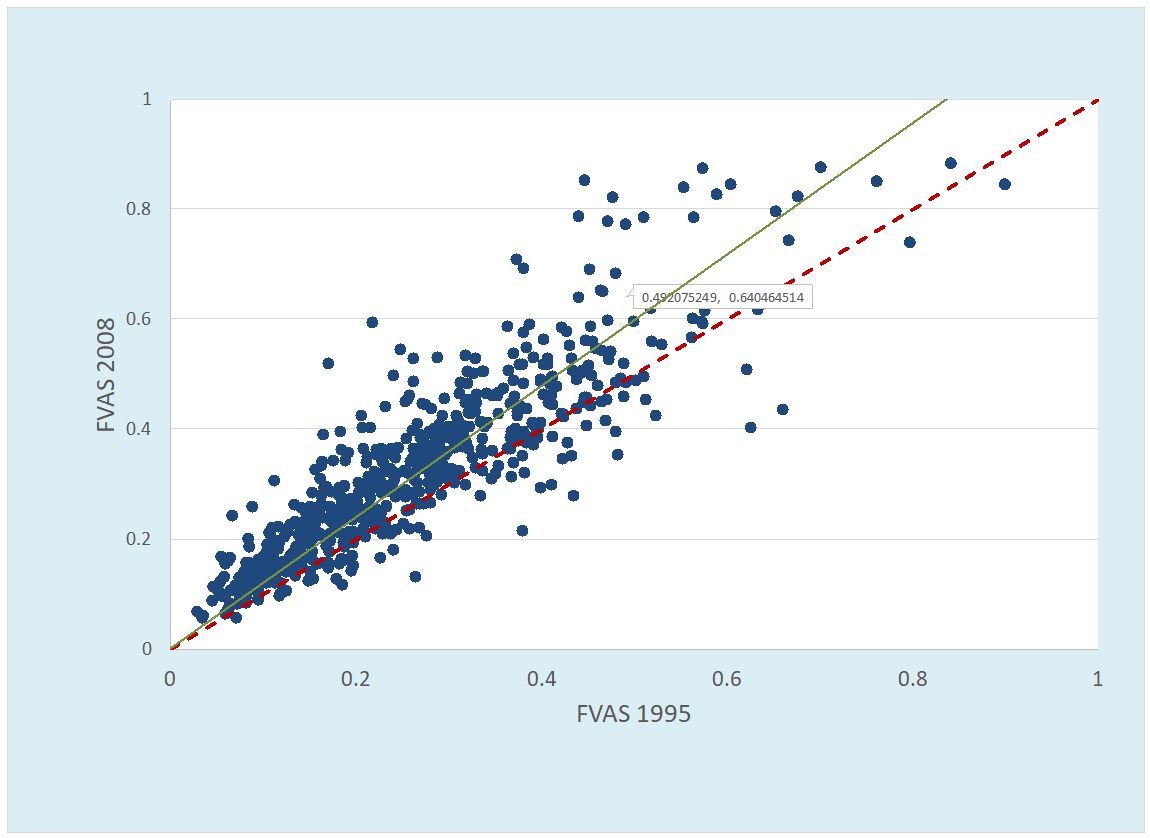
Figure 2 Foreign value added shares in output of final manufactures (1995 and 2008)
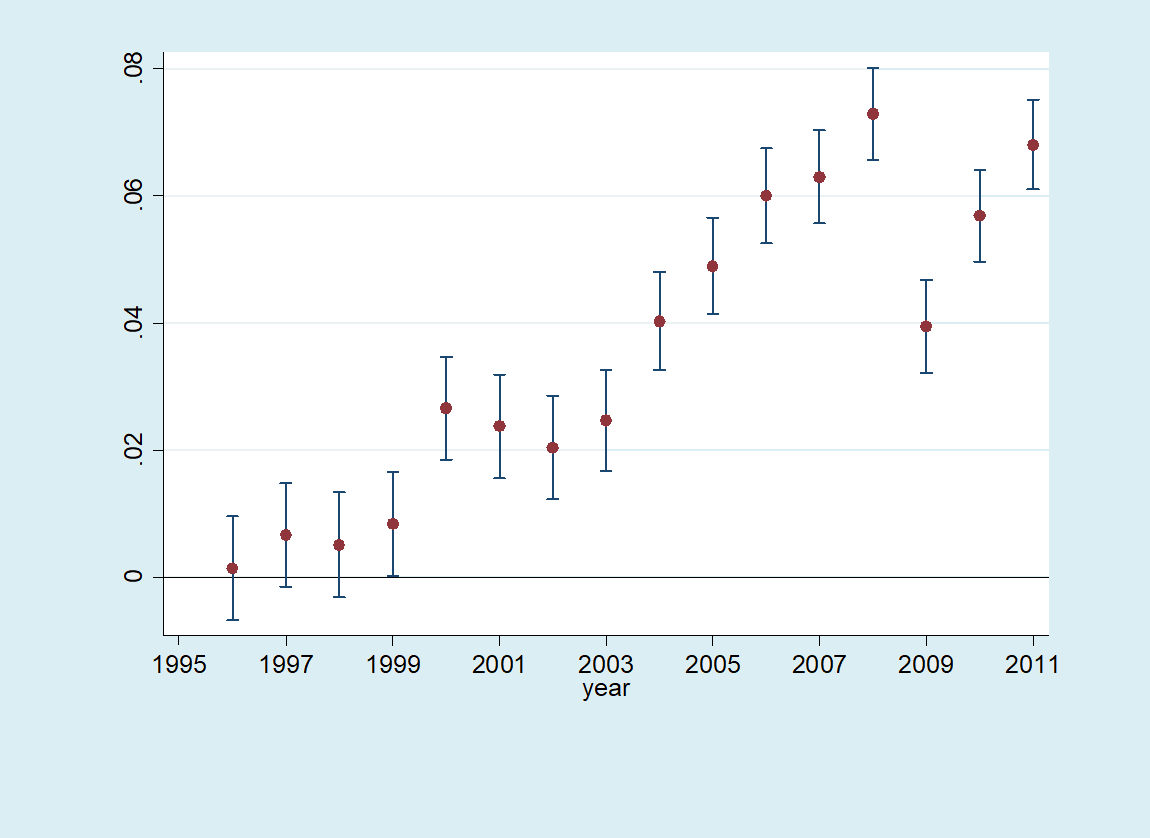
Figure 3 Trend in international fragmentation of value chains
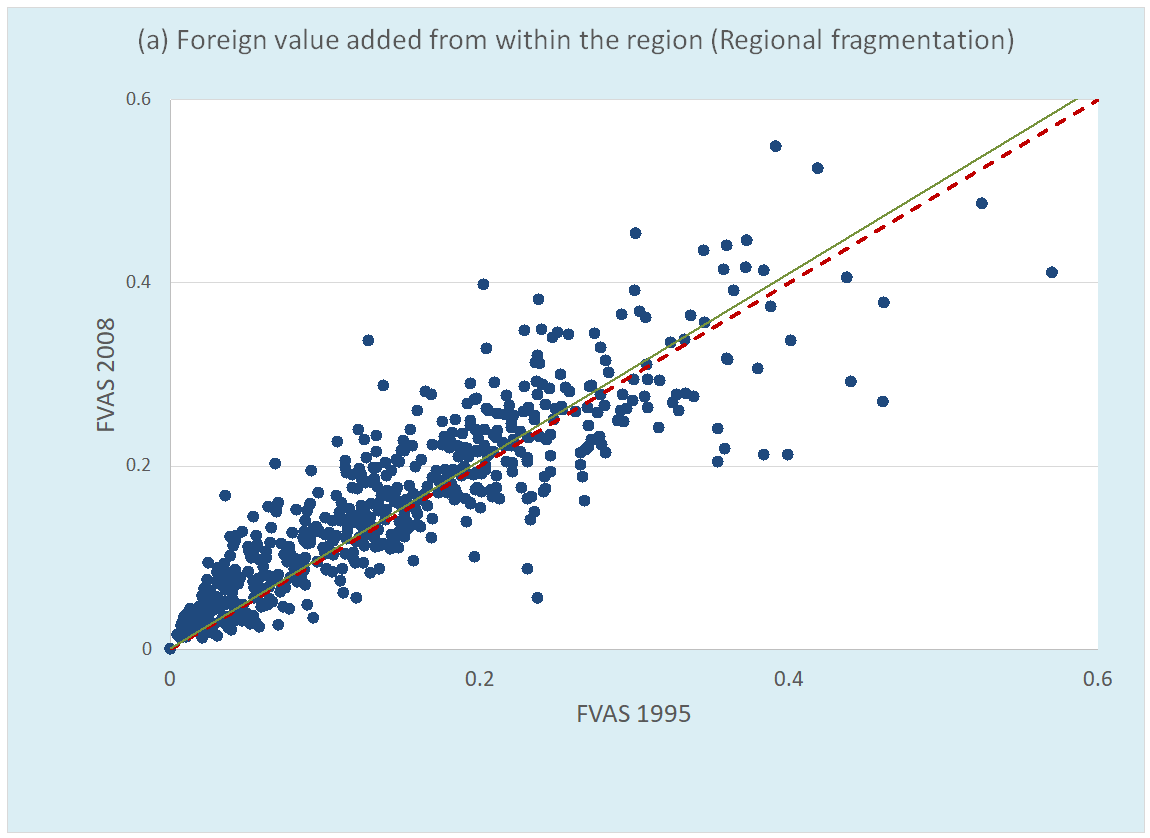
Figure 4 Foreign Value Added shares in output of final manufactures
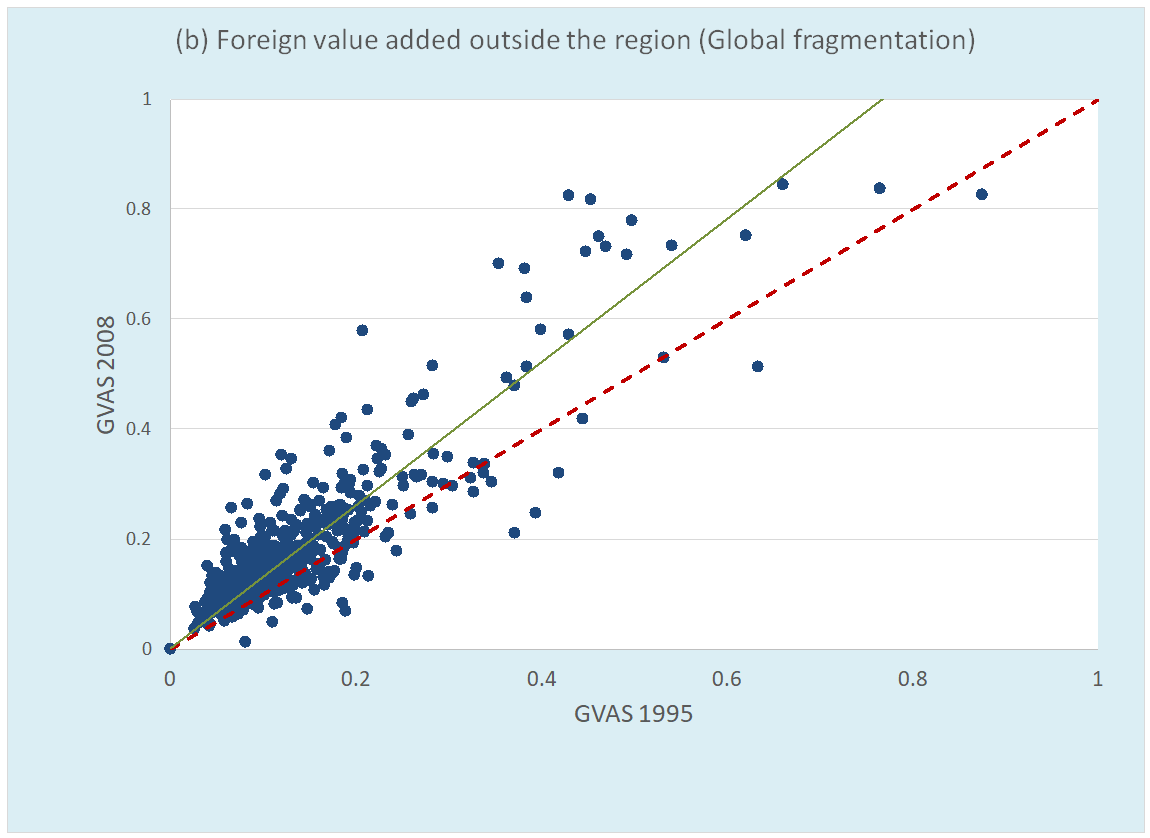
Figure 4 Foreign Value Added shares in output of final manufactures
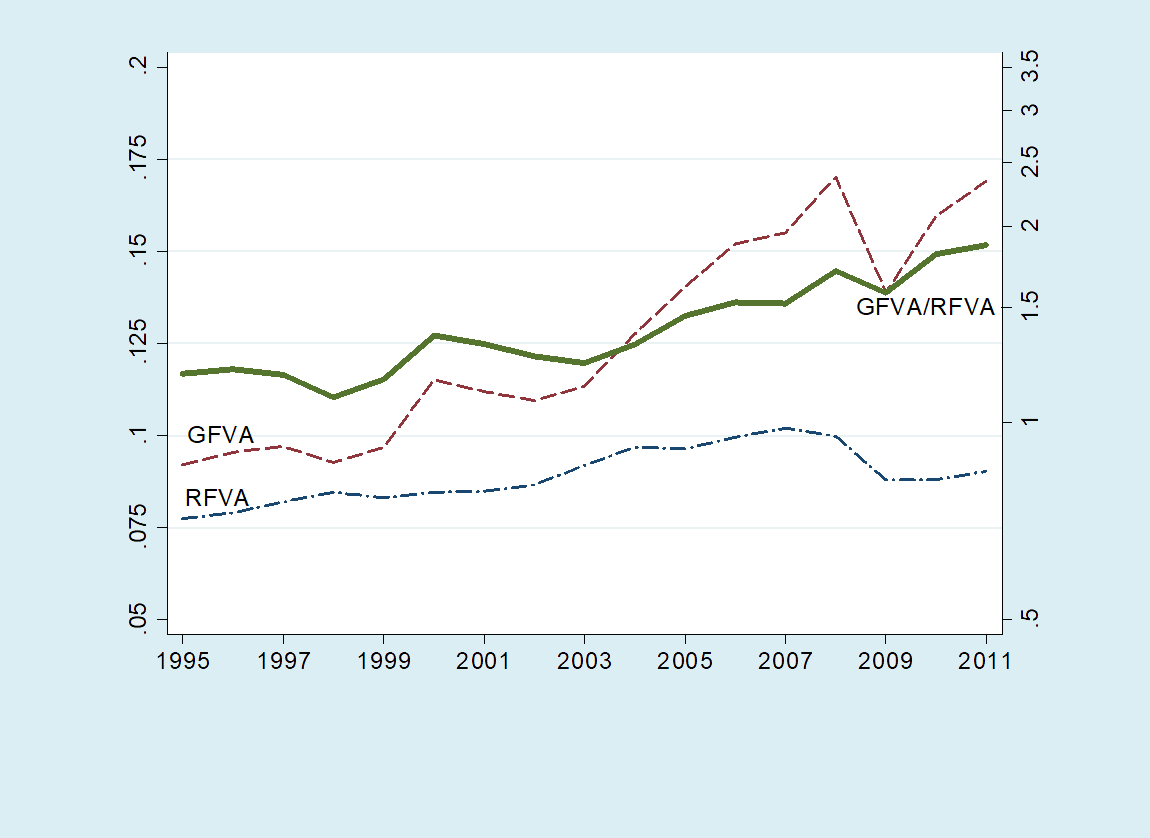
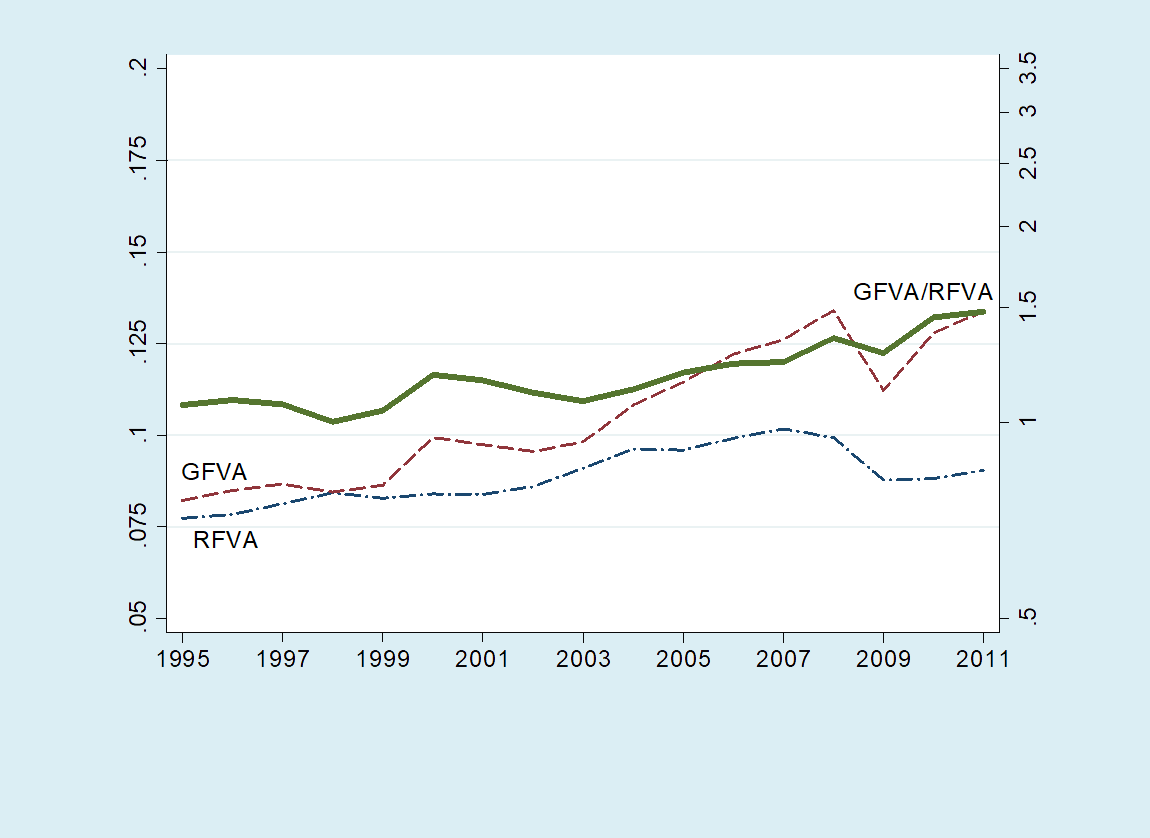
Figure 5 Trends in regional and global fragmentation of value chains of final manufactures. (a) 34 countries-of-completion in EU, East Asia and NAFTA
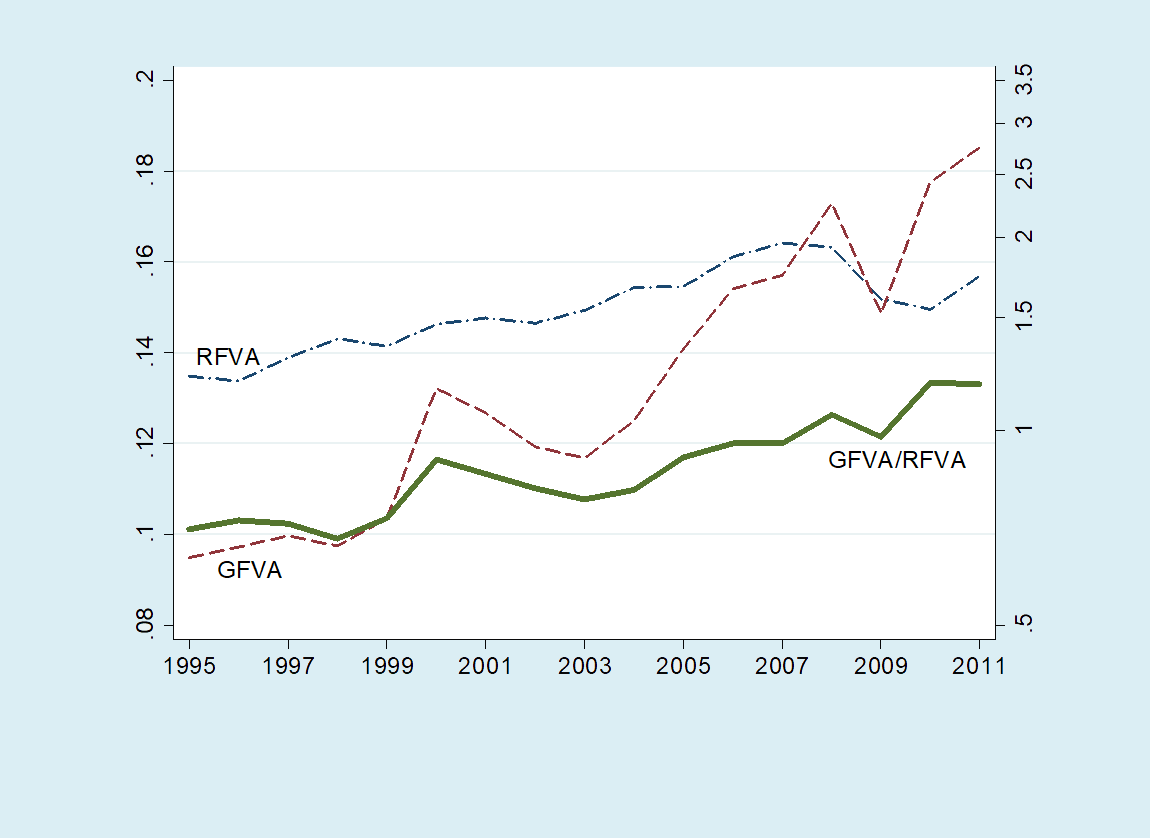
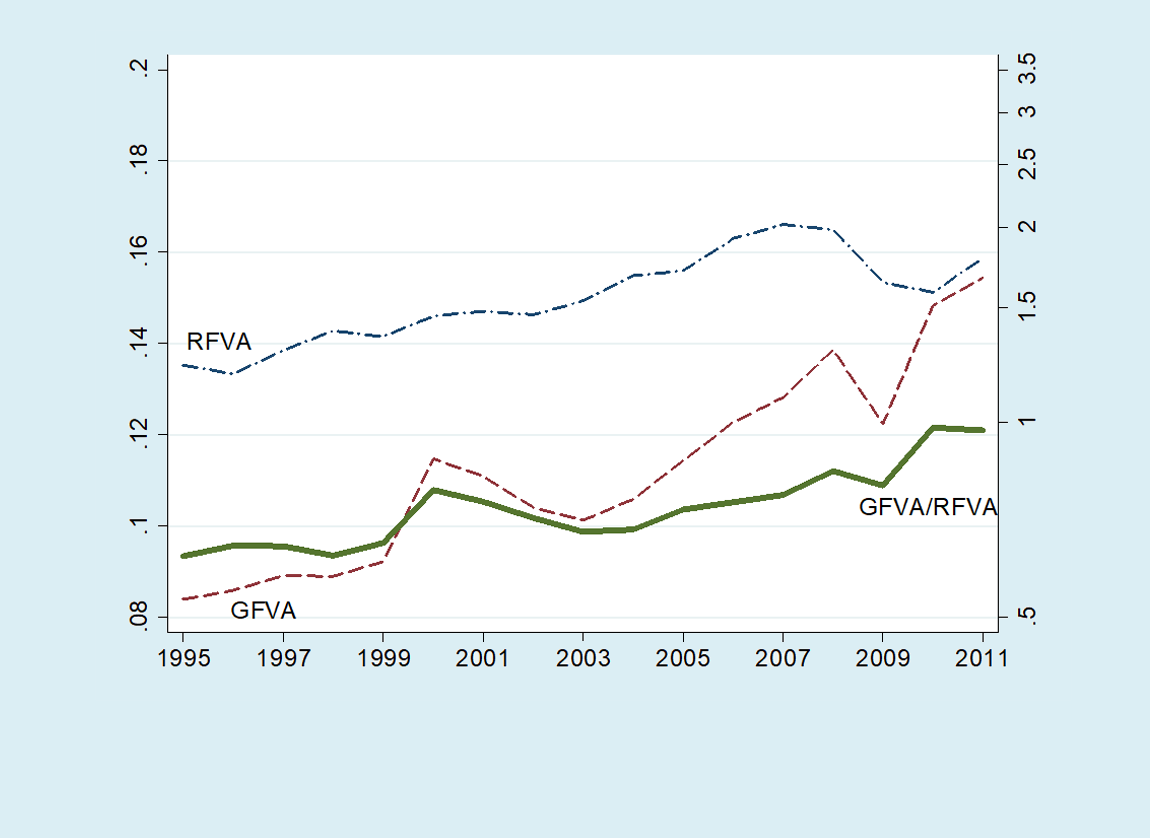
Figure 5 Trends in regional and global fragmentation of value chains of final manufactures. (b) 27 countries-of-completion in Europe
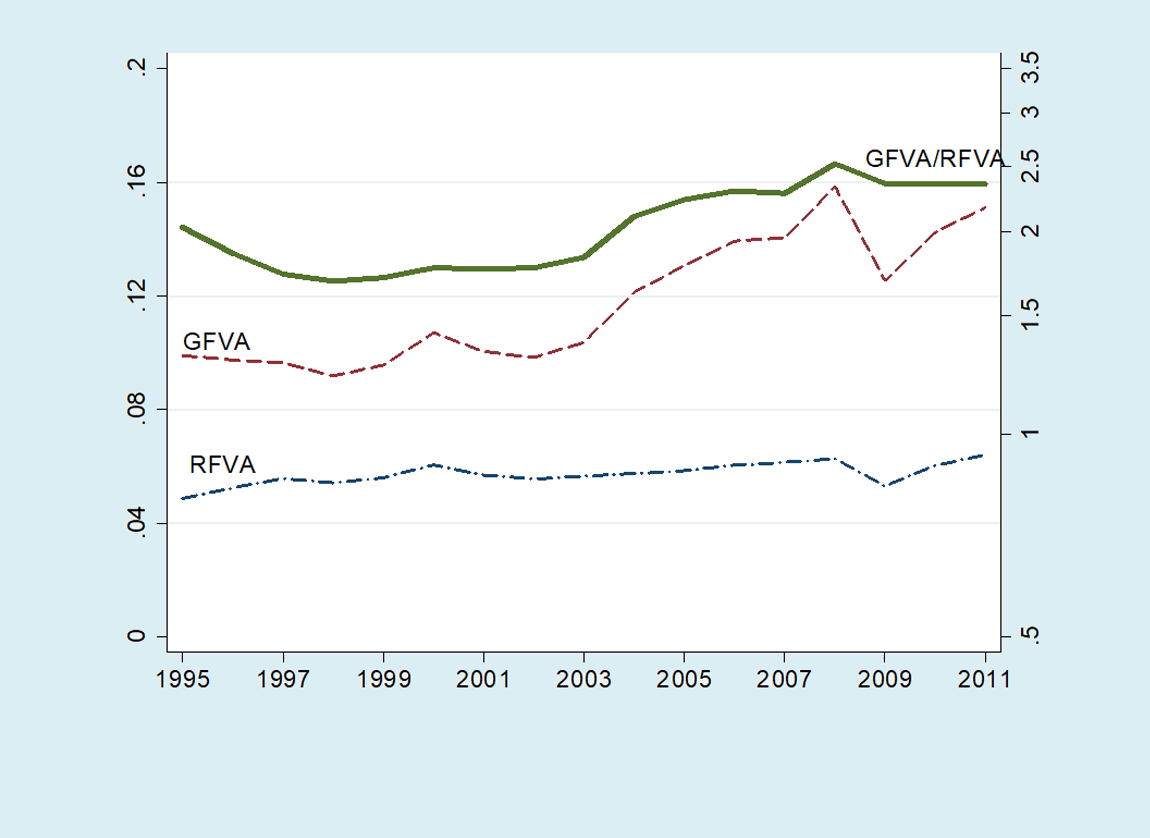
Appendix Figure B1. Trends in regional and global fragmentation of value chains for NAFTA and East Asia. (a) Three countries-of-completion in NAFTA
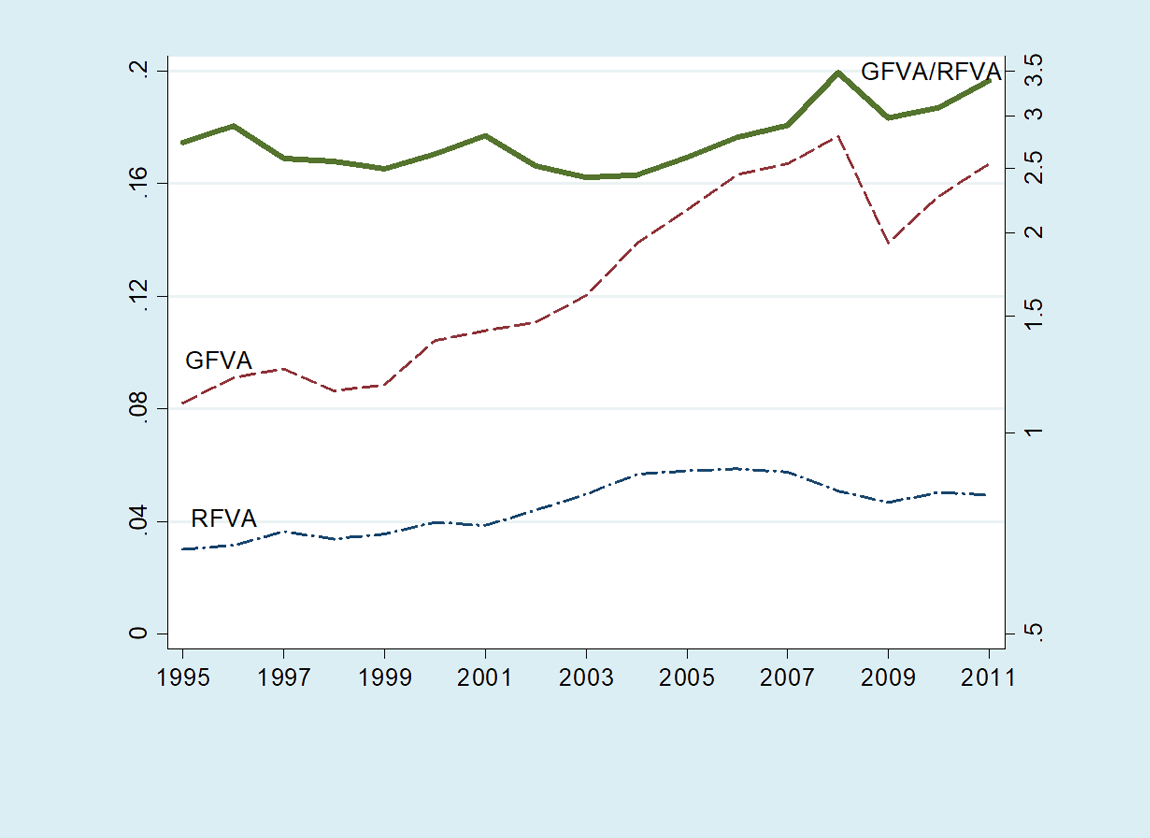
Appendix Figure B1. Trends in regional and global fragmentation of value chains for NAFTA and East Asia. (b) Four countries-of-completion in East Asia
Appendix Figure B2. Trends in regional and global fragmentation of value chains, exclusive of value added in mining industries. (a) 34 countries-of-completion in EU, East Asia and NAFTA
Appendix Figure B2. Trends in regional and global fragmentation of value chains, exclusive of value added in mining industries. (b) 27 countries-of-completion in Europe
Tables
Last modified:11 June 2026 11.46 a.m.