
Economic Policy
| Figures and Tables are taken from the following paper: |
|---|
| Timmer, M. P., Los, B., Stehrer, R., & De Vries, G. J. (2013). Fragmentation, incomes and jobs: an analysis of European competitiveness. Economic policy, 28(76), 613-661, DOI: 10.1111/1468-0327.12018 |
Figures
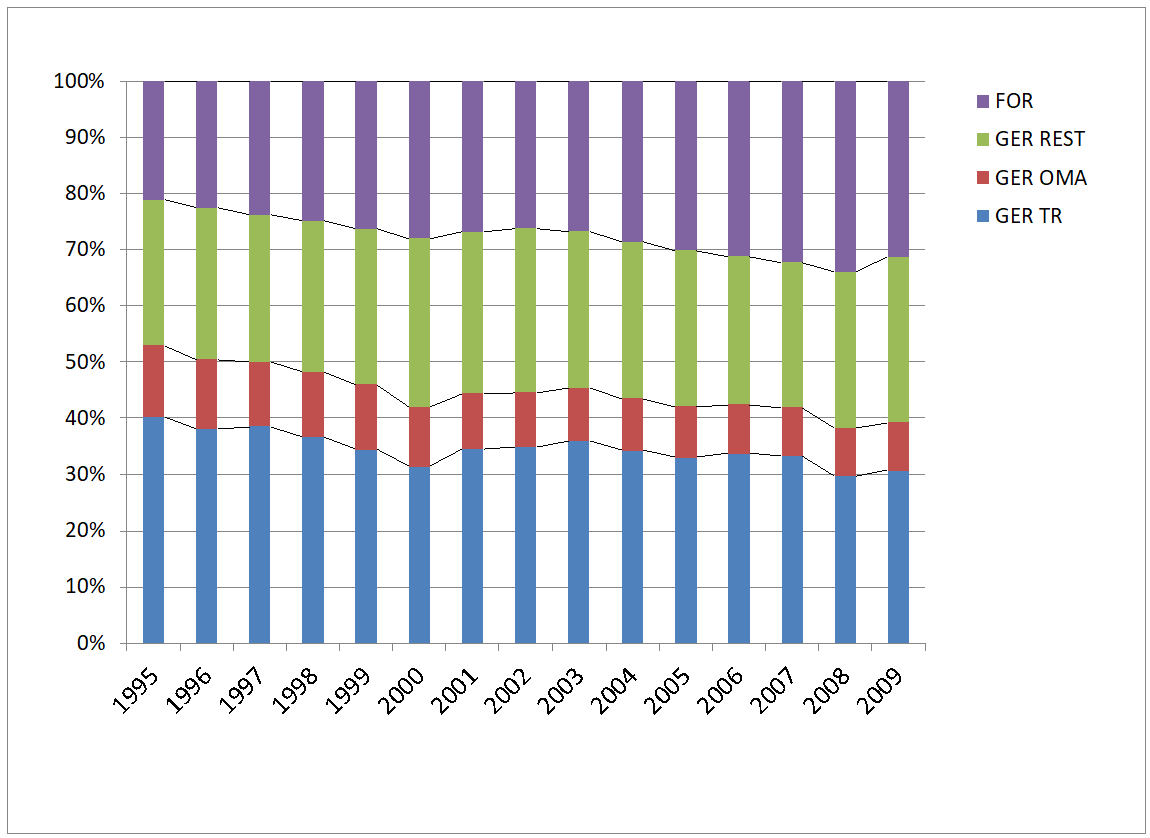
Figure 1 Value added and workers involved inproduction of German transport equipment: (a) GVC income shares (in %)
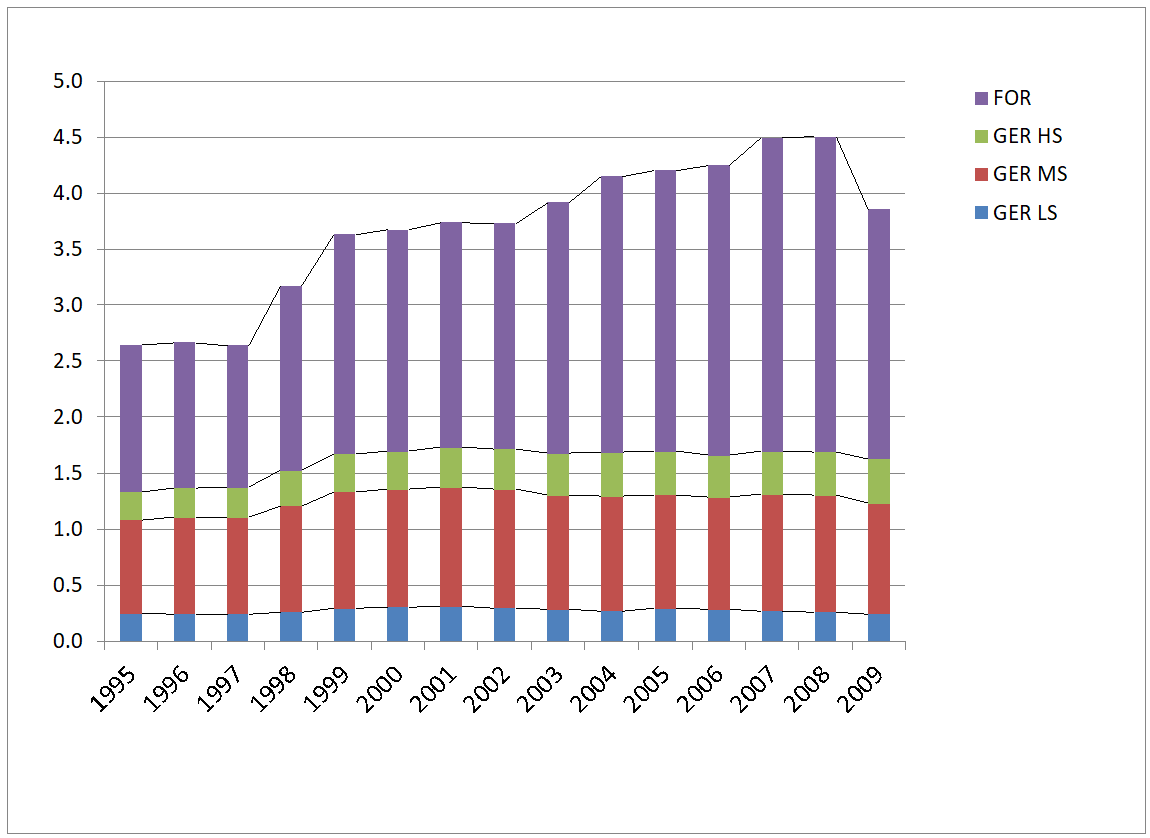
Figure 1 Value added and workers involved inproduction of German transport equipment: (b) number of GVC workers (in millions)
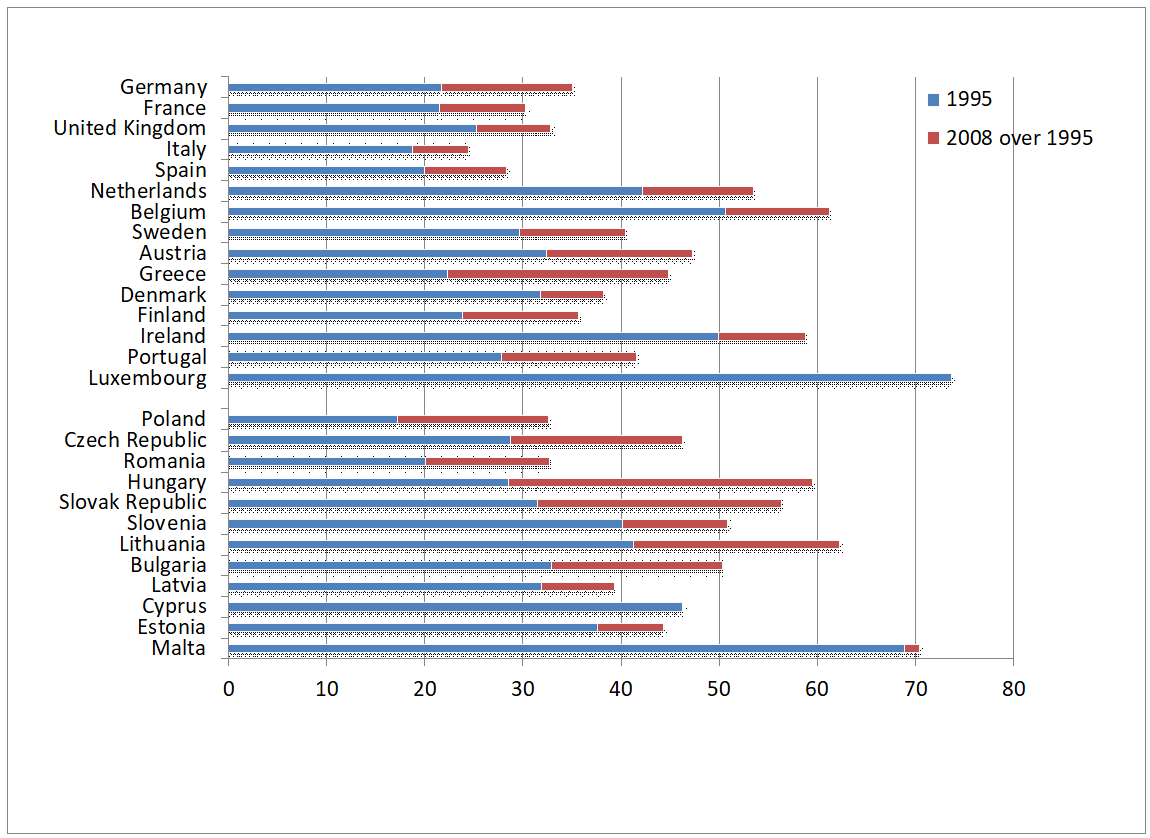
Figure 2 International fragmentation of production
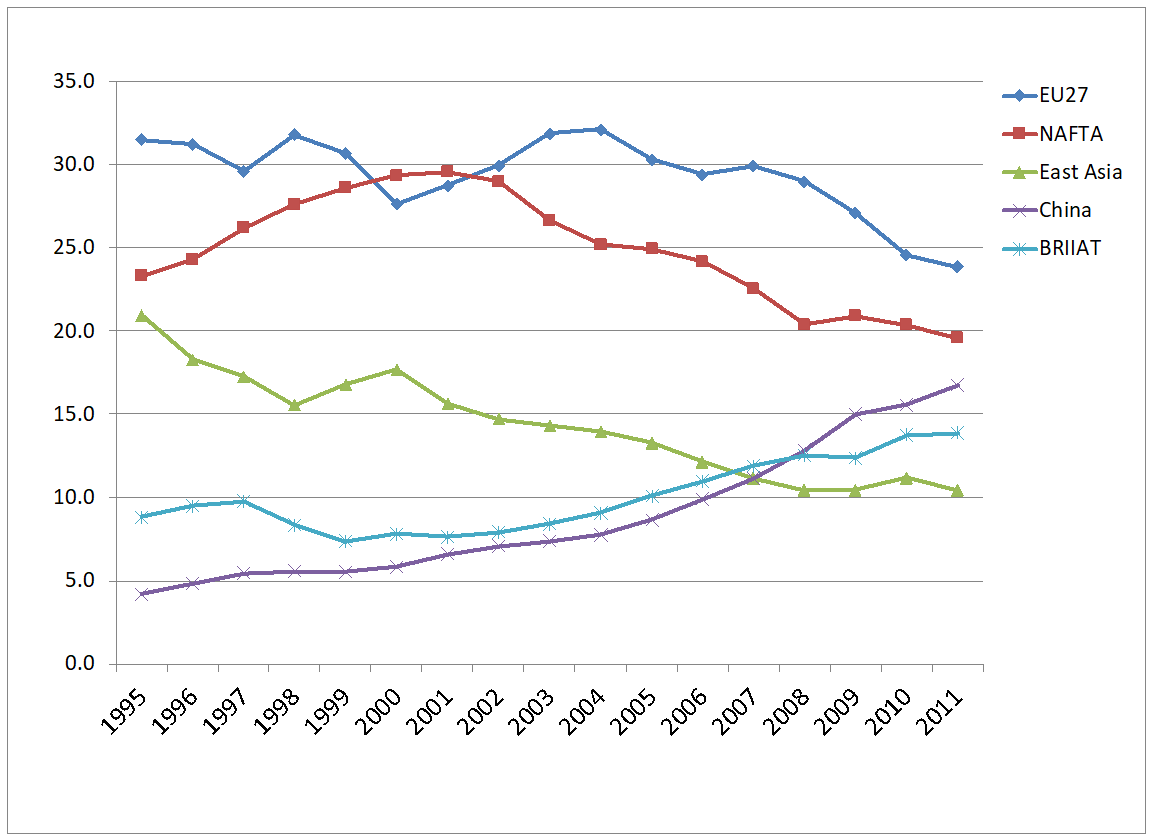
Figure 3 Regional shares in world GVC income for all manufactures (%)
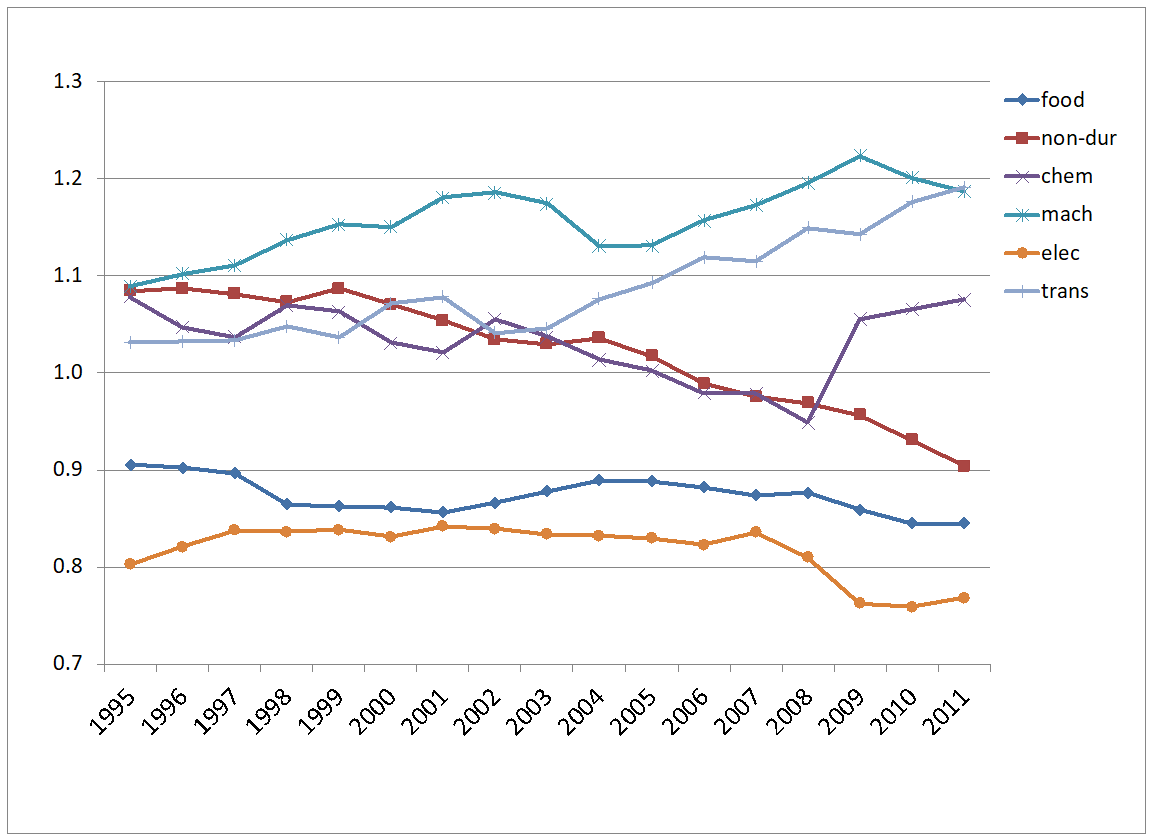
Figure 4 Revealed comparative advantage of EU27, by group of final manufactures (%)
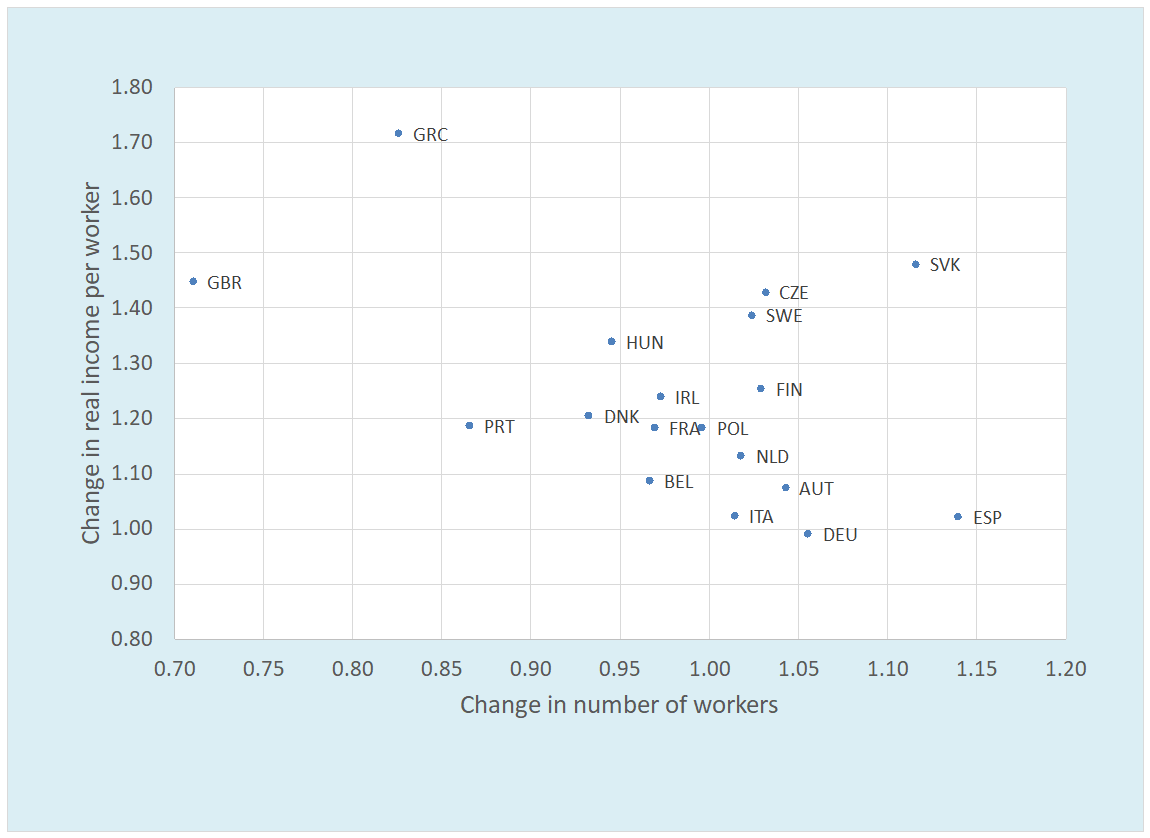
Figure 5 Change in employment versus change in real wage in manufactures GVCs, 1995–2008 (1995 = 1)
Tables
| Table | Description |
|---|---|
| Table 1 | Real GVC income across countries, all manufactures. (Annual data) |
| Table 2 | Decomposition of change in manufactures GVC income due to change in production structure and final demand. |
| Table 3 | Revealed comparative advantage based on GVC incomes by product, 1995 and 2008. (Annual data) |
| Table 4 | Growth in manufacturing exports and manufactures GVC income between 1995 and 2008 (%). |
| Table 5 | Manufactures GVC workers, 1995 and 2008, by sector. (Annual data) |
| Table 6 | Growth in manufactures GVC workers (in %), by skill level, 1995–2008. |
Last modified:07 April 2026 2.25 p.m.