
Maddison project, re: "Don't believe the Haiti/DR graph"
Craig Palsson discusses a graph, based on the dataset made by Maddison and the Maddison Project (MPD), which shows the dramatic divergence between Dominican Republic and Haiti since the early 1950s. His main point is that ‘the graph is wrong’ because it shows that in the early 1950s Haiti was more or less at par with the Dominican Republic, or perhaps even slightly richer, which in his view is impossible, given what he knows about the two economies at the time. He concludes to ‘never trust the Maddison data’.
The Maddison Project does two things: first it collects, reviews, and standardizes time series of real GDP and population of almost all countries in the world - some of which go back in time to the Middle Ages. Second, the project it aims to make these series comparable over time and space, using purchasing power parities (PPPs) benchmarks from the World Bank / ICP (most recent available years are 2005, 2011 and 2017).
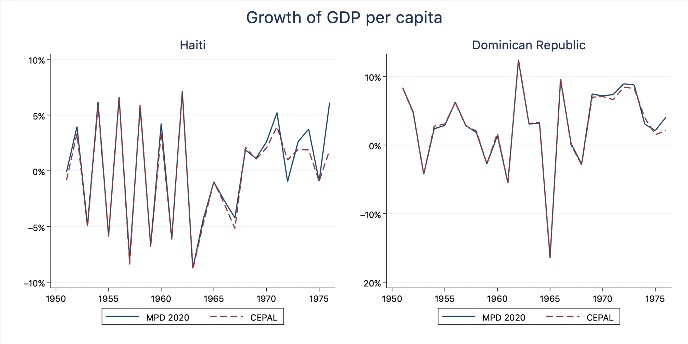
When comparing the series for Haiti and the Dominican Republic included in the Maddison Project database to the data Graig Palsson shows from Series históricas del crecimiento de América Latina (CEPAL), our graph (at the bottom) shows that there is a large degree of consensus about the trends of GDP per capita in the Dominican Republic and Haiti, the growth rates from both databases are very similar.
As a result, both databases show that whatever the income gap in 1950, it has increased substantially since then. This does not come as a surprise since Maddison made use of the CEPAL data for these two countries. So far, so good, and no reason to distrust our data.
Where both databases differ is in the choice of the PPP benchmark used to convert the income series into a single currency to make the comparison between the countries over time. Maddison preferred his own 1990 benchmark, which shows a DR/H ratio of 2.45/1 in 1990; this may have been an underestimate, as Craig suggests (as it leads to in his view unplausible MPD results for the 1950s). the CEPAL uses a 1970 benchmark, which gives a ratio of 4.3. The DR/H ratio according to the 2011 ICP study was 7 (which is consistent with the 2.45 for 1990) and for 2017 it is 10 (but this benchmark was not yet available to us when putting together the 2020 update; both countries did not participate in the 2005 ICP round).
Selecting which benchmark to use is a complex issue as all benchmarks have their pros and cons and contain certain margins of error. We have analyzed this in detail in our 2020 paper, where we decided to use the 1990 benchmark for the extension of series back in time, resulting in estimates which, if Craig is correct, are unsatisfactory for the DR-H comparison for the 1950s. The underlying problem is the inconsistency of time series estimates of GDP growth and benchmark studies estimating relative levels of GDP per capita for a specific year. Due to changes in relative prices and budget shares as well as due to measurement errors, successive benchmarks and the time series that link them, never fit exactly. More interesting is to analyze the underlying patterns: some countries do not grow rapidly, but still become extremely rich (at the next ICP benchmark) – some oil producing countries which experienced rapid prices increases are cases in point – whereas other countries do grow a lot but do not achieve a comparable rise in GDP per capita (at the next ICP benchmark), probably because of unfavorable changes in relative prices.
Such biases may also help to explain why ‘the graph is wrong’, because the growth paths of the two countries were so different. The strategy to cope with this problem is to create independent benchmark estimates for historical periods, to test the accuracy of the GDP pc gaps that is projected back in time. In our 2020 paper we have collected the available independent benchmarks and where necessary, adapted the GDP estimates accordingly. This is also what we would like to suggest to Craig: the building blocks for an independent estimate of the relative level of GDP per capita in the 1950s are available, so let us improve the quality of the Maddison dataset by adding such a benchmark DR/H to it. The strategy Maddison masterminded over the years, and that the project has further developed, aims at adding new estimates – better time series, new benchmark studies – to gradually improve the quality and extend the scope of this kind of work. So that, at a distant point in the future, even goodly PhD advisors will say ‘Do trust the Maddison data’.
P.S. It would have been more constructive if Craig would have asked for our comments before putting this blog online. At one point he simply misunderstands what we have done and accuses us of adjusting the estimates for Haiti ‘to look better’ (and even concludes: ‘Holy Crap! H and DR look the same in the 1950s because the data collectors assumed they were the same’). This borders on questioning our scientific integrity – or even goes beyond it. That is not how academics – or indeed humans - should interact; academic exchanges – assuming that this is what we try to do – have other rules of the game than those of Twitter or Facebook.
We of course did not do such a thing (that is, change numbers to make them look better). We compared different methods to extrapolate time series back in time and studied the consequences of the various alternatives (no harm done; we think). One of the criteria for assessing the quality of the resulting estimates was to see how many backward ‘predictions’ resulted in levels of GDP per capita which were below subsistence (as it is the assumption that most societies in most times manage to feed and clothe their populations). So, we did not alter the estimates. Instead, we selected a method for backward projection that resulted in the most plausible results given the underlying data.
Jutta Bolt and Jan Luiten van Zanden