Reference radiocarbon values for 100% biogenic carbon (14Cbio) based on atmospheric 14CO2
University of Groningen (RUG) | Energy and Sustainability Research Institute Groningen (ESRIG) | Centre for Isotope Research (CIO).
Contact person: Safoora Kamjan, s.kamjan rug.nl | Version: 5 July 2021 (update of previous version; 7 November 2019).
These data may be freely used to obtain 14C reference values for 100% biogenic carbon, provided that reference is made to this document (webpage) in reports and also to the references of Palstra and Meijer (2014 and 2018; see reference list) in the open (scientific) literature.
Table 1. Annual 14Cbio values based on averaged monthly mean 14CO2 values (January-December) measured at CIO monitoring station Lutjewad, The Netherlands for the period 2003-2020.
|
Year |
14
Cbio REF value |
|---|---|
| 2003 | 106.3 |
| 2004 | 106.5 |
| 2005 | 105.8 |
| 2006 | 105.4 |
| 2007 | 104.9 |
| 2008 | 103.7 |
| 2009 | 104.1 |
| 2010 | 104.2 |
| 2011 | 103.3 |
| 2012 | 102.9 |
| 2013 | 102.6 |
| 2014 | 102.0 |
| 2015 | 101.8 |
| 2016 | 101.2 |
| 2017 | 101.2 |
| 2018 | 100.7 |
| 2019 | 100.3 |
| 2020 | 100.2 |
For the time period before 2003 we refer to Meijer et al. (1995) and Palstra and Meijer (2018) for data from monitoring station Smilde, The Netherlands (time period 1975 – 2003) and Levin and Kromer (2004) for data from monitoring stations Vermunt (Austria) and Jungfraujoch (Switzerland) (time period 1959 – 2003).
The monthly mean values mentioned in these papers can be used to calculate annual 14Cbio values for the years before 2003. To obtain insight in atmospheric 14CO2 differences on a global scale, see Hua et al. (2013).
Reference 14C value for 100% biogenic carbon
In the 14C-based method to measure the biogenic carbon fraction in a sample material, the principle is used that biogenic carbon contains 14C in an amount comparable to current atmospheric 14CO2 levels, and fossil carbon contains no 14C anymore. When biogenic and fossil carbon atoms are mixed, the overall relative 14C amount in the total carbon decreases proportional with the decrease in biogenic carbon fraction. To calculate the biogenic carbon fraction in a sample material, 14C is measured in the carbon of the sample and this value is compared with the 14C value of the biogenic carbon fraction, 14Cbio. In international standards this value is also called the reference 14C value for 100% biogenic carbon: “REF”.
Biogenic carbon fraction, fCbio = 14Csample / 14Cbio
See Palstra (2016) and the references in that publication for background information on the method and its applications.
Due to temporal and spatial variations in atmospheric 14CO2 values (e.g. Levin and Kromer, 2003 and Meijer et al., 1995), the 14Cbio values of biogenic material show these variations as well. In those cases where the sample material is already a mixture of fossil and biogenic carbon and the biogenic carbon is not separately available for 14C measurement, the 14Cbio value should therefore be approximated. In Palstra and Meijer (2014), an approximation method is described in more detail for biogases. The main principle to approximate the 14Cbio value of a particular sample material, however, can be applied to other bio-based materials as well. In this approximation method biogenic materials can be divided into groups with different average carbon age. That is: the overall time period in which the carbon in the material was taken up from the atmosphere. This can be for instance annual data for products from annual plants from a specific year, or three-year averages for annual-plant-based materials of unknown previous years. Or five-year averages for products that are animal (waste) based. Or an approximated 14Cbio value based on specific year distributions for wood-based and waste-based materials (Mohn et al., 2008 and Fellner and Rechberger, 2009). The 14Cbio values for the different groups can be calculated using annual atmospheric 14CO2 values as measured at specific representative monitoring stations for the specific and relevant time periods.
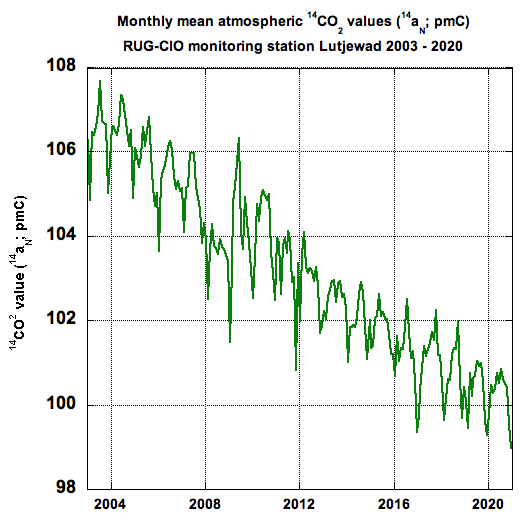
Table 1 shows the annual 14Cbio values for the time period between 2003 and 2020, based on averaged monthly mean atmospheric 14CO2 values measured at monitoring station Lutjewad, The Netherlands (University of Groningen). These data can be used as reference values for annual 14Cbio values in this specific time period.
Due to seasonal and spatial variations in atmospheric 14CO2 values, the averaged 14CO2 values of Lutjewad of Table 1 might not be fully representative for all investigated biogenic materials. For annual plants that grow in the summer period only, the 14CO2 value can be slightly higher compared to the given annual values of Lutjewad, which also includes the winter time period (with increased fossil CO2 emissions and no plant growth). For example the average April-October monthly mean 14CO2 values measured at Lutjewad are in average +0.35% higher. Biomass from areas with many fossil fuel emissions has lower 14CO2 values compared to biomass grown in remote areas. We have therefore decided to calculate the average 14CO2 value based on all months in a year, including fossil contributions (as measured in the winter period) and remote contributions (as measured in the summer period).
Hence, the 14CO2 values measured at monitoring station Lutjewad, located at the coast in the Northern part of the Netherlands (Europe), represent 14Cbio values for sites that are neither remote (with relatively higher 14C values compared to global averages) nor urban (with relatively lower 14C values compared to global averages).
The given values of table 1 should be considered as indicative annual 14Cbio values. Spatial differences of ± 0.5 pmC with theses 14Cbio values are likely to exist. For biomass materials with biomass from different growth years the anomaly can be even larger due to the uncertainty in the approximation of the overall 14Cbio value for mixed bio-based or (mixed) wood-materials (unknown distribution of carbon uptake during an unknown time period).
Although there might be slight differences on a local and regional scale and also seasonally in atmospheric 14CO2 values, the long-term annual (decreasing) trend at Lutjewad follows the global trend. Over the last 15 years the average annual decrease was 0.35 pmC per year.
Additional information about the measured atmospheric 14CO2 data at Lutjewad
The applied method to obtain the monthly mean 14CO2 values is as following. For each month of the year, atmospheric air is pumped during one month, 24 hours a day, through an alkaline solution (1.5 M NaOH) at a constant flow. The CO2 from the air is dissolved in this solution. The solution is taken to the RUG-CIO laboratory in Groningen for further preparation and measurement. The CO2 is released in a special system after the addition of acid (H3PO4) to the alkaline solution. Up to 2011 we measured the total CO2 amount (a few litre) from the sample directly after the extraction using a proportional gas counter. Since 2011 we extract a subsample of the total alkaline solution in a vacuum pumped system and divide the obtained amount of CO2 over three flasks. Each of the flasks contains approximately 4 ml of CO2. Each CO2 sample is graphitized and the graphite targets are measured on the abundance of carbon isotopes 12C, 13C and 14C with an Accelerator Mass Spectrometer (AMS). Between 2011 and May 2017 the 14CO2 Lutjewad samples were measured with a 2.5 MV Tandetron built by HVEE (van der Plicht et al., 2000). Since May 2017 we measure the samples with a 200 kV AMS, MICADAS (Ionplus AG). The measured 14C signal is calculated relative to the measured 12C signal and is corrected for background counts. The isotope ratio is then calculated relative to a reference material with standardized 14C amount and is corrected for isotope fractionation, based on measured 13C/12C ratios.
Atmospheric 14CO2 values are often also corrected for 14C decay and expressed in ‰, as “delta” values. Expressed as a percentage the calculated 14C values can then be symbolized as 14aN S value (Mook and van der Plicht, 1999). For bio-fossil carbon fraction measurements, however, this particular decay correction is not necessary if the 14Cbio value, used to calculate the biogenic carbon fraction is also not decay-corrected and is representative in time origin for the biogenic carbon in the sample.
The 14Cbio values for the years 2003-2020 as given in table 1 are not corrected for decay and are therefore symbolized as 14aN values. These 14Cbio values are calculated in %, but because the biogenic carbon fraction is also a percentage this can result in confusion whether a given 14C value expressed in % already shows a biogenic carbon fraction or not. Therefore, 14Csample and 14Cbio values are expressed with the unit ‘pmC’ (percent modern Carbon).
References
Fellner, J., Rechberger, H., 2009. Abundance of 14C in biomass fractions of wastes and solid recovered fuels. Waste Management, 29(5), 1495-1503.
Hua, Q., Barbetti, M., Rakowski, A.Z., 2013. Atmospheric radiocarbon for the period 1950- 2010. Radiocarbon, 55(4), 2059-2072.Hua, Q., Barbetti, M., Rakowski, A.Z., 2013. Atmospheric radiocarbon for the period 1950- 2010. Radiocarbon, 55(4), 2059-2072.
Levin, I., Kromer, B., 2004. The tropospheric 14CO2 level in mid-latitudes of the Northern Hemisphere (1959-2003), Radiocarbon, 46(3), 1261-1272.
Meijer, H.A.J., van der Plicht, J., Gislefoss, J.S., Nydal, R., 1995. Comparing long-term atmospheric 14C and 3H records near Groningen, The Netherlands with Fruholmen, Norway and Izaña, Canary Islands 14C stations, Radiocarbon, 37(1), 39-50.
Mohn, J., Szidat, S., Fellner J., Rechberger, H., Quartier, R., Buchmann, B., Emmenegger, L., 2008. Determination of biogenic and fossil CO2 emitted by waste incineration based on 14CO2 and mass balances. Bioresource Technology, 99(14), 6471-6479.
Mook, W., van der Plicht, J., 1999. Reporting 14C activities and concentrations. Radiocarbon, 41(3), 227-239.
Palstra, S.W.L., Meijer, H.A.J., 2014. Biogenic carbon fraction of biogas and natural gas fuel mixtures determined with 14C, Radiocarbon, 56(1), 7-28.
Palstra, S.W.L., 2016. On 14C-based methods for measuring the biogenic carbon fraction in fuels and flue gases. PhD thesis, University of Groningen, 2016. 160 p. link to PhD thesis.
Palstra, S.W.L., Meijer, H.A.J., 2018. Poster presentation: “Atmospheric 14CO2 data sets from Dutch monitoring stations Smilde (1995-2003) and Lutjewad (2002-present)”, 14C conference, June 2018, Trondheim, Norway. A paper with an overview of the data is in preparation.
Van de Plicht, J., Wijma, S., Aerts, A.T., Pertuisot, M.H., Meijer, H.A.J., 2000. Status report: the Groningen AMS facility. Nuclear Instruments in Physics Research B, 172(1-4), 58-65.
| Last modified: | 30 January 2024 10.58 a.m. |