Logarithmic graph paper
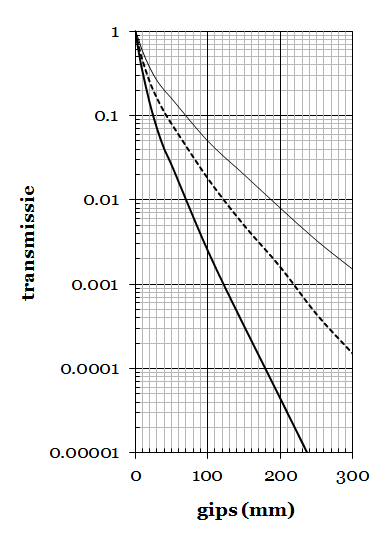
For the training Radiation Protection Officer (RPO) it is sufficient that one can interpret a curve plotted on logarithmic graph paper. The figure given above shows the number of photons that pass a layer of plaster. The vertical direction indicates the number of photons on a logarithmic scale and in the horizontal direction the thickness of the layer is plotted on a linear scale. The decrease of the number with increasing thickness reflects the transmission.
Note that the distance between the points 101 and 102 on the vertical axis equals the distance between the points 102 and 103. This distance apparently corresponds with a factor of 10.
The horizontal grid lines between the point 101 = 10 and 102 = 100 mark the values 20, 30, 40, 50, 60, 70, 80 and 90. Note that the distance between the points 10 and 20 is equal to the distance between the points 20 and 40, and also to the distance between 40 and 80. This distance corresponds with a factor of 2.
| Last modified: | 12 November 2020 12.35 p.m. |